You can predict how the coleoptile will grow if you know four things: the seedling's age and growth stage, the direction and intensity of light hitting it, how well-hydrated the tissue is, and the ambient temperature. Get those inputs right, and you can build a testable expectation for both its final length and the angle at which it will curve. This guide walks you through exactly how to do that, step by step.
Predict How the Coleoptile Will Grow: A Step-by-Step Method
Marcus Whitmore
13 Apr 2026
What sets coleoptile growth rate and direction
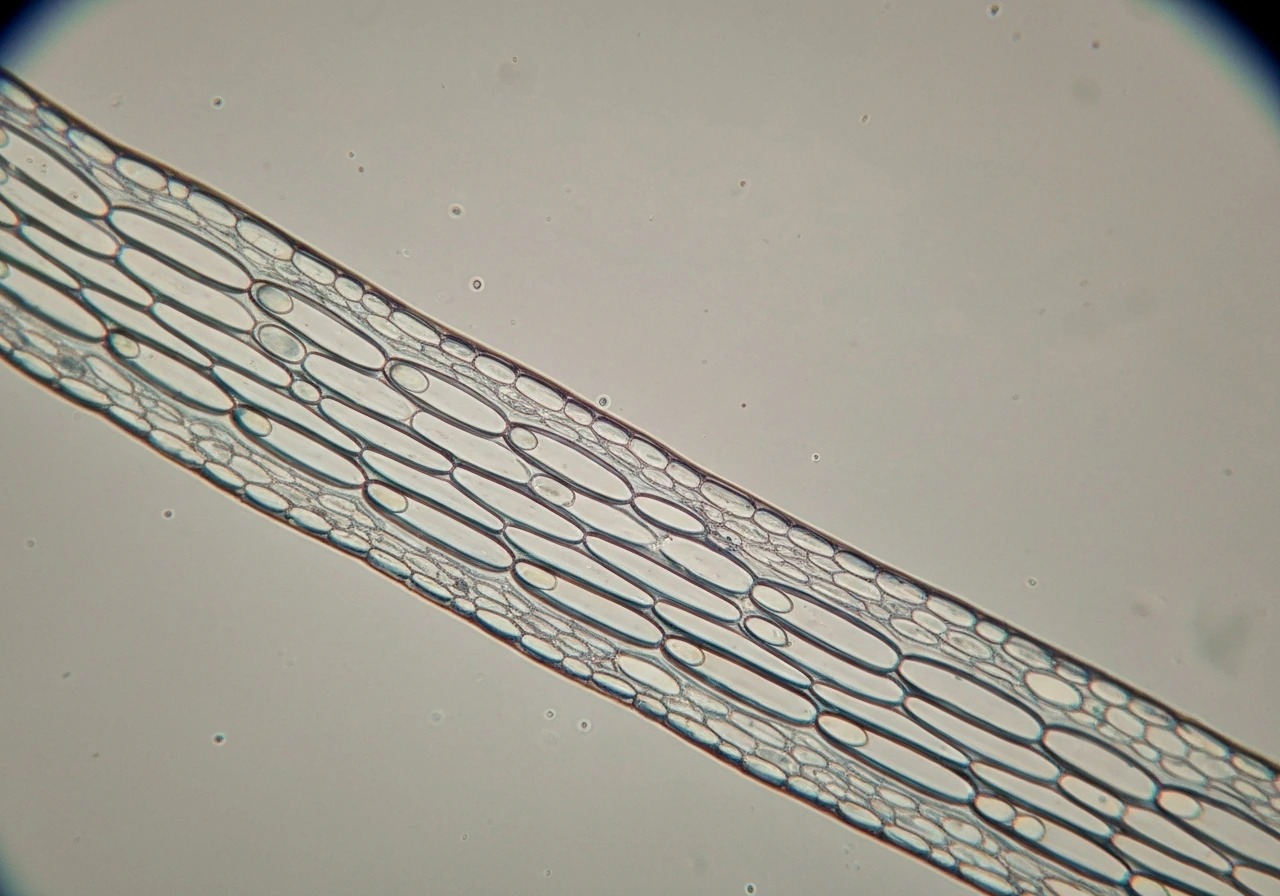
A coleoptile grows mostly by cell elongation, not cell division. That distinction matters a lot for prediction. When a grass seedling pushes its coleoptile upward in the first few days after germination, the cells in the elongation zone are expanding lengthwise by absorbing water and loosening their walls, not multiplying. The proteins doing the wall-loosening work are called expansins, and they act like molecular ratchets: they weaken the hydrogen bonds in the cell wall just enough to let turgor pressure stretch it outward. Wheat and maize coleoptiles are the classic experimental models here, and research on both has confirmed that expansin activity, not cell division rate, is the primary driver of elongation speed.
That said, environmental conditions can shift the balance. Under low-oxygen conditions (like waterlogged soil), the basal region of the rice coleoptile becomes more heavily involved in both elongation and cell division, showing that the contribution of each process is not fixed. For most lab or classroom predictions, though, you can treat elongation as the dominant mechanism and focus your inputs there.
Direction is governed almost entirely by auxin (IAA) redistribution. When light hits one side of the coleoptile, auxin migrates to the shaded side, causing cells there to elongate faster, bending the tip toward the light source. Gravity works the same way: auxin accumulates on the lower side of a tilted coleoptile, driving upward curvature. Knowing which directional stimulus is dominant in your setup lets you predict not just how much it bends, but which way.
How to predict coleoptile length (and curvature) from inputs
Think of this as a simple input-output model. You plug in your conditions, and the model tells you what to expect. Here is a practical framework you can apply before you even start measuring.
- Establish your baseline: Measure the coleoptile length at the moment you introduce your experimental stimulus (light direction, temperature shift, water restriction). Call this L0. Also note seedling age in days post-imbibition.
- Estimate your growth window: Most rapid elongation in cereal coleoptiles occurs between days 1 and 4 post-germination. If your seedling is in this window, expect the highest daily length increments. After day 4, the rate typically plateaus.
- Apply a temperature correction: Coleoptile elongation roughly doubles for every 10°C increase within the optimal range (roughly 15°C to 30°C). If your room is 20°C instead of 25°C, expect noticeably slower growth.
- Factor in auxin sensitivity: Maximal elongation response to IAA is maintained across a surprisingly broad concentration range (roughly 3×10⁻⁷ M to 10⁻³ M). This means small fluctuations in endogenous auxin within that range will not dramatically change your length prediction, but concentrations far outside it will.
- Build your length prediction: For a healthy, well-watered seedling at 25°C under diffuse or no directional light, expect roughly 1 to 3 mm of daily elongation depending on species. Write that as a range: L_predicted = L0 + (rate × days).
- Add a curvature prediction: If unilateral light is present, expect measurable curvature (typically 10° to 30°) within 60 to 90 minutes of stimulus onset. Auxin asymmetry reaches a detectable basal level at around 90 minutes after blue-light stimulation begins, so plan your first angle measurement at that time point.
- State your prediction explicitly before collecting data: Write it down. 'I expect the coleoptile to reach X mm and show Y degrees of curvature toward the light source after Z hours.' This forces clarity and makes validation straightforward.
Curvature predictions are especially satisfying to test because the mechanism is so well-defined. The auxin signal triggers downstream ionic changes (including proton pump activation and K⁺ flux adjustments) within minutes, and the mechanical bending follows. The whole sequence from photon detection to visible curvature unfolds on a timescale of minutes to hours, so you do not need to wait days to check whether your prediction holds.
Light-driven growth: phototropism and auxin/IAA distribution
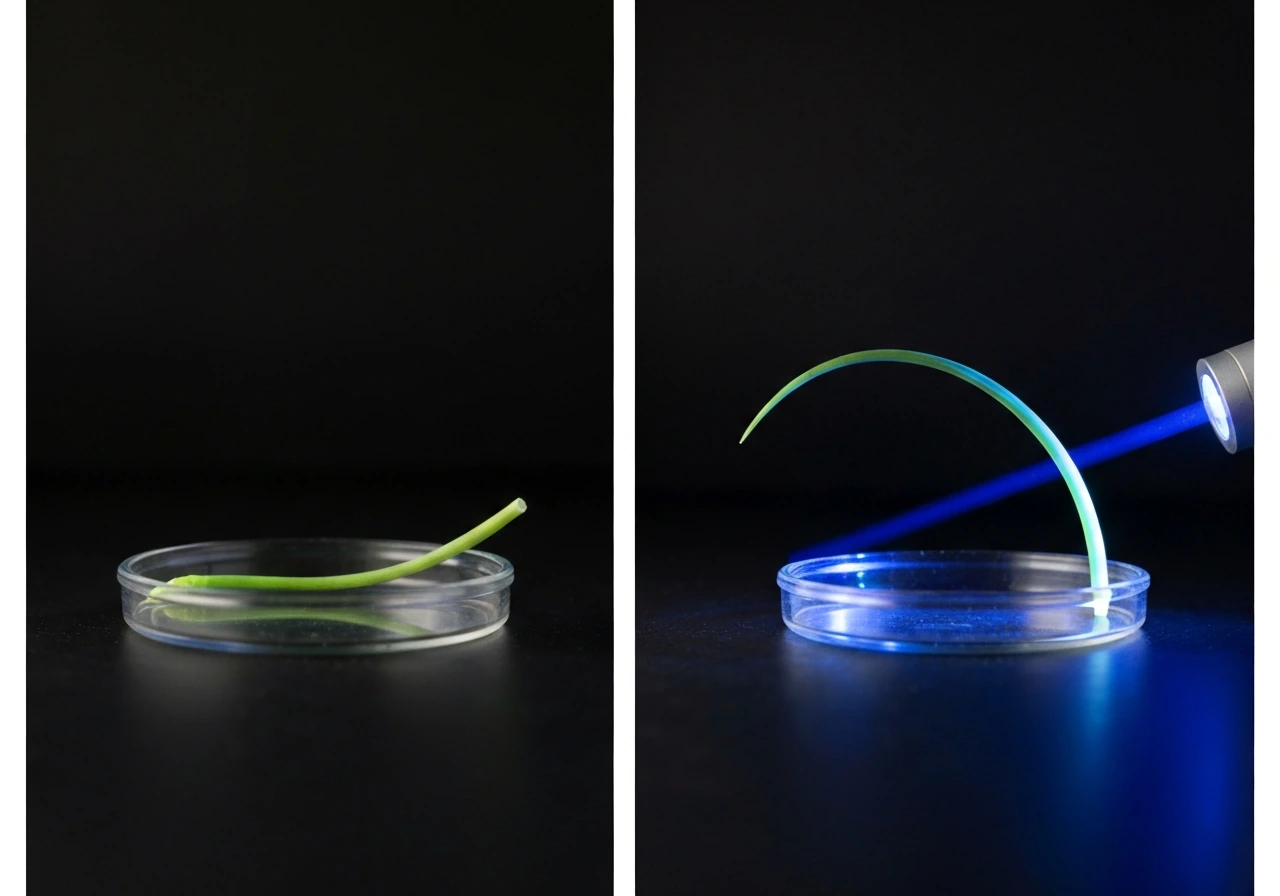
Phototropism in coleoptiles is one of the most mechanistically well-understood growth responses in all of plant biology, which makes it excellent for prediction. Blue light is the primary trigger. Phototropin receptors in the coleoptile tip detect blue light and initiate a lateral redistribution of auxin from the lit side to the shaded side. This asymmetry translates directly into asymmetric elongation: more auxin on the shaded side means more expansin activation and more wall loosening there, so those cells get longer. The tip bends toward the light.
The timing is tighter than most people expect. Ion flux changes associated with phototropic bending begin within 5 to 20 minutes of light exposure, and electrical/charge-balancing changes stabilize around 10 to 15 minutes in. Visible bending typically becomes measurable within 30 to 60 minutes, and the auxin asymmetry driving it reaches a steady-state level by roughly 90 minutes.
A teaching/lecture resource on Chapter 39 plant responses to internal stresses reports a classroom-friendly timing for coleoptile response to light colors of about 90 minutes, which can guide time-course planning [auxin asymmetry driving it reaches a steady-state level by roughly 90 minutes](https://ocw. nthu. edu. tw/ocw/upload/17/341/%E3%80%90L08%20%E8%AA%B2%E7%A8%8B%E5%A4%A7%E7%B6%B1%E3%80%91Ch39-pre.
pdf). If you are designing a time-course experiment, take measurements at 30, 60, 90, and 120 minutes for the clearest picture of how curvature evolves.
Light intensity matters too. A weak, diffuse light source will produce slower and shallower bending than a bright, collimated beam. For predictions, use the strongest directional light source you can control consistently. A single desk lamp with a cardboard collimator (a tube to narrow the beam) is enough to get repeatable results in a classroom setting. If you want to understand the downstream molecular steps more deeply, how microtubules grow is worth reading, since cytoskeletal remodeling is part of how cells commit to a new elongation direction during bending.
One thing to watch: the acid-growth pathway connects auxin to wall loosening through plasma-membrane proton pumps. Auxin activates those pumps, which acidify the apoplast (the space outside the cell membrane), and that lower pH activates expansins. In oat coleoptile cells, experiments testing acid-growth predictions found that IAA and fusicoccin treatments that lower wall pH are associated with elongation treatments that lower wall pH (including IAA and fusicoccin) are associated with elongation. This is why treatments that interfere with pH (like buffered growth media at neutral pH) can blunt your predicted curvature even when auxin distribution is normal. Keep this in mind if your predictions repeatedly underestimate bending speed.
Water, nutrients, and turgor as growth 'constraints'
Wall loosening only translates into actual elongation if turgor pressure is high enough to push the cell walls outward once they have been loosened. Think of the cell as a balloon: loosening the rubber helps, but you still need air pressure inside to inflate it. If water is scarce and the tissue water potential drops below the threshold needed to maintain turgor above the cell wall's yield point, growth stops. This is the core 'rate gating' concept for hydration constraints.
Research on wheat coleoptiles under water stress has shown that drought-resistant cultivars maintain faster coleoptile elongation partly because they sustain higher expansin activity even when water is limited. So water stress hits elongation in two ways: it reduces turgor directly, and over longer timescales it can also reduce expansin expression. Your predictions need to account for both. A well-hydrated coleoptile on moist filter paper in a Petri dish will outgrow the same seedling on dry paper by a measurable margin within 24 hours.
Nutrients are a secondary constraint for short-term predictions (days 1 to 4), since the seed endosperm supplies most of what the coleoptile needs early on. Over longer periods, nitrogen availability affects cell-wall extensibility pathways. Experiments with osmotic and salt stress have shown that manipulating expansin gene expression can shift coleoptile length by 30 to nearly 100 percent, which tells you how sensitive the elongation machinery is to anything that interferes with osmotic balance. Structures that weave webs as they grow provide an interesting parallel here: like a coleoptile, they depend on a consistent physical scaffolding process to maintain directional growth, and disrupting the scaffold chemistry changes the output.
For practical predictions, here is a simple constraint checklist to run through before you finalize your expected growth rate:
- Is the growing medium consistently moist? If not, reduce your length prediction by 30 to 50 percent.
- Is temperature stable within the optimal range (15°C to 30°C)? Fluctuations above or below will compress your growth window.
- Is the coleoptile free to elongate mechanically? Physical crowding, a tight seed coat still attached, or a compressed growing substrate can all limit growth regardless of water and hormone status.
- Are you using tap water with high salt or chlorine content? Ionic stress from salinity inhibits elongation in the elongation zone and will make your length predictions consistently too high.
Measuring growth and validating your prediction experimentally
Good measurement design is what separates a prediction from a guess. The core principle is to take repeated measurements over time rather than just a start and end point. A time-course approach catches whether the coleoptile is in its fast-elongation phase, decelerating, or stalled, and it shows you whether curvature is still developing or has stabilized.
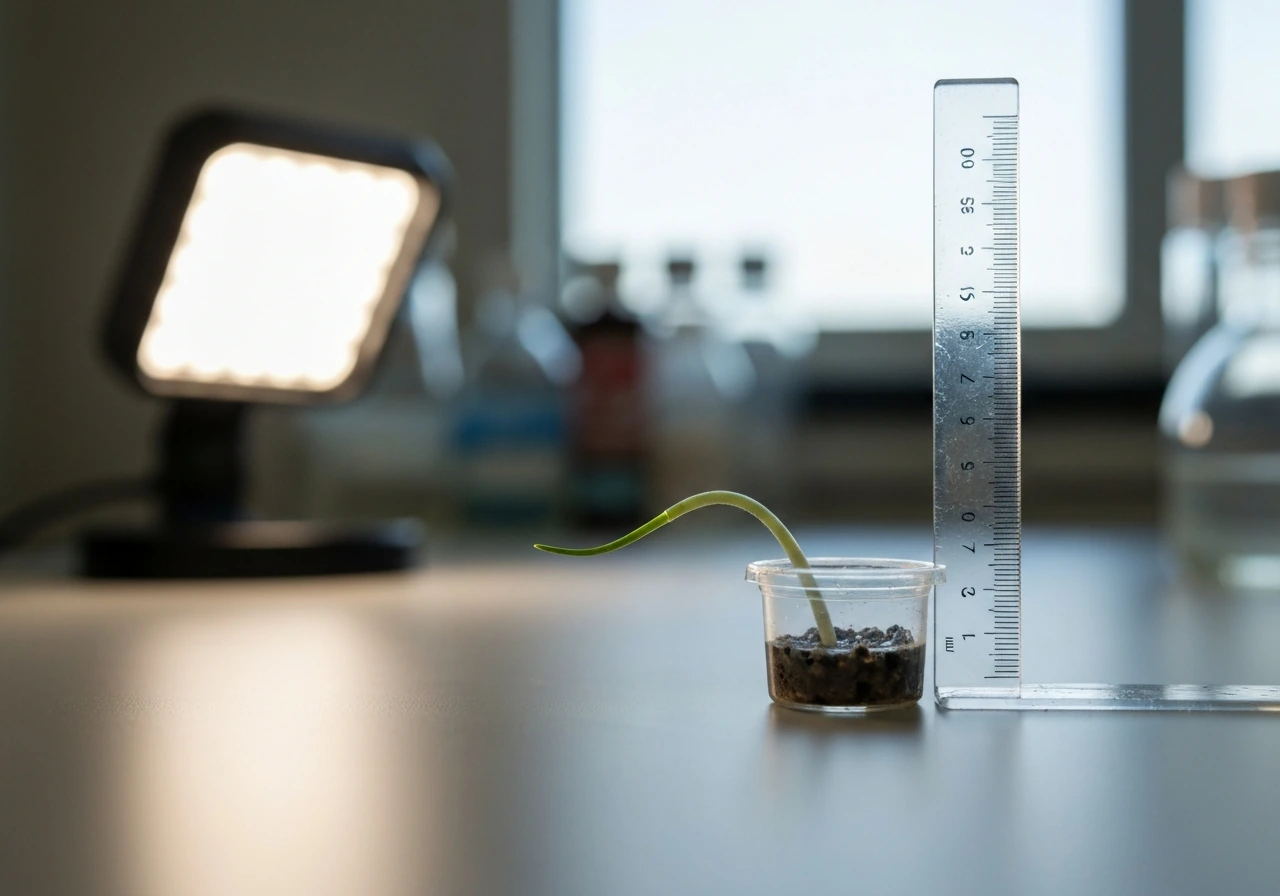
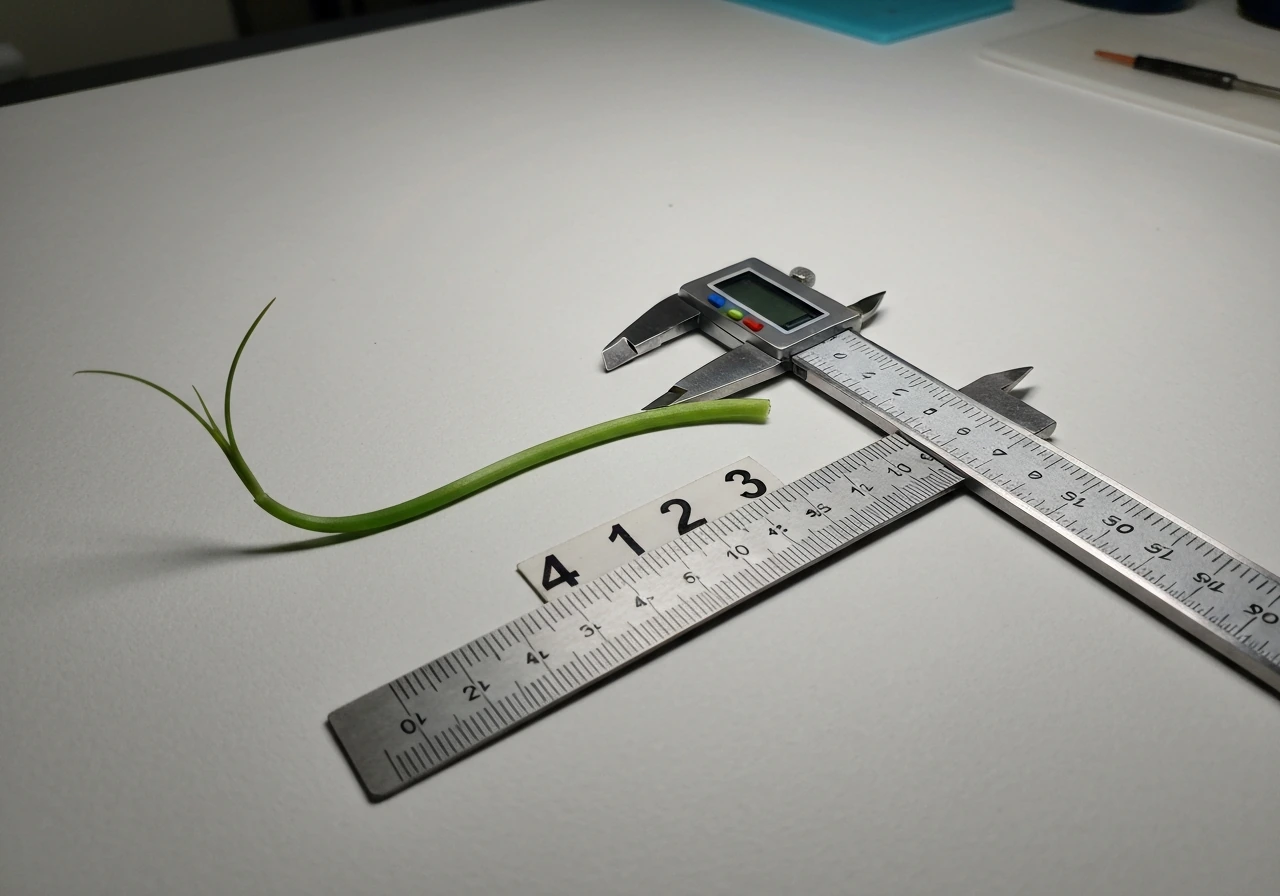
For length: use a fine ruler or digital calipers to measure from the base of the coleoptile (where it meets the seed/mesocotyl) to the tip. Measure at the same time of day each session to avoid confounding circadian effects. Record in millimeters and plot your data as length vs. time. If your prediction was a straight line (constant rate) and the data show a curve, that tells you something is changing in growth rate that your model did not account for.
For curvature: photograph the coleoptile from the side against a grid background at each time point. Measure the angle between the base of the coleoptile and a vertical reference line. Many free phone apps can measure angles directly from an image. Take photos at 30, 60, 90, and 120 minutes after introducing a directional light or gravitational stimulus. Compare your measured curvature angle at each time point against your pre-stated prediction.
You can also do segmental analysis: mark the coleoptile at 1 mm intervals with a fine waterproof marker before the experiment starts, then photograph at intervals. This tells you exactly which region (tip vs. base) is contributing most to elongation. This is useful because auxin-driven elongation is concentrated in the upper elongation zone, while mechanical constraints from the growing medium often restrict the base. Understanding which cells are actually doing the work is also why it helps to have some background on how microtubules grow and shrink during cell expansion, since microtubule orientation directly controls the direction of new cell wall material deposition and thus which axis the cell elongates along.
Finally, always run a control: an identical seedling kept in the same conditions but without your experimental stimulus (no directional light, no tilting, no water restriction). Compare your experimental coleoptile to the control at every time point. Deviations between the two are your signal; deviations between your prediction and the data are your learning opportunity.
Limits and common reasons predictions fail
Even a well-constructed prediction will miss sometimes. Here are the most common failure modes and what to do about each.
| Failure mode | What happens | How to fix it |
|---|---|---|
| Incorrect light geometry | Light source is too diffuse or not truly unilateral, so auxin redistribution is weak or symmetrical. Curvature is less than predicted. | Use a collimated single light source. Cover all ambient light. Confirm the beam angle with a ruler before starting. |
| Delayed auxin response | You measure curvature too early (under 30 min) and conclude no bending is happening, when it simply has not started yet. | Wait at least 60 to 90 min before your first curvature measurement. Auxin asymmetry takes time to build. |
| Inconsistent hydration | Growth rate varies between replicate seedlings because some filter paper patches dry faster than others. | Seal Petri dishes with Parafilm or use a humidity chamber. Check moisture at every measurement time point. |
| Mechanical constraint from seed coat | The coleoptile cannot elongate freely because the seed coat is still tightly attached, compressing the base. | Gently remove or score the seed coat before the experiment if you need clean elongation data. |
| Wrong growth phase assumed | You assume rapid elongation is still occurring on day 5 or 6, but the coleoptile has already entered the plateau phase. | Track seedling age carefully. For most cereals, rapid elongation peaks between days 1 and 4. |
| Misreading which region is growing | You measure total length but the tip is elongating while the base is compressing slightly, giving a smaller net gain than expected. | Use ink marks at 1 mm intervals to track segment-by-segment elongation rather than total length only. |
| Auxin concentration outside effective range | You apply exogenous IAA at a concentration above 10⁻³ M (supraoptimal) and see growth inhibition instead of stimulation. | Use IAA in the 10⁻⁷ to 10⁻⁵ M range for reliable stimulation. Check your stock solution concentration and dilution math. |
One subtler failure mode is assuming that individual coleoptiles respond identically. Even among carefully matched seedlings, there is natural variation in elongation initiation timing, and at least two distinct timing mechanisms appear to operate across a population of coleoptiles exposed to the same IAA concentration. This means your prediction is really a population average, and you should always measure at least three to five replicates per condition to get a meaningful result. A single coleoptile that grows unusually slowly or quickly is not necessarily evidence that your prediction was wrong.
It is also worth remembering that turgor can actually dip slightly during a rapid growth response, which seems counterintuitive. Research on light-growth responses has recorded a small but detectable decrease in turgor pressure during transient increases in elongation rate, because water uptake temporarily lags behind wall expansion. If you are measuring turgor as a proxy for growth capacity, a brief dip does not mean growth is stopping. It means the cell is expanding faster than water can flow in, and turgor will recover once the water potential gradient catches up.
Coleoptile biology also connects to other directional growth systems worth understanding for context. For example, what stimulates the pollen tube to grow involves many of the same auxin and turgor-driven mechanics in a different tissue, and comparing the two helps you see which principles are universal versus coleoptile-specific. Similarly, how the pollen tube grows down the style is a beautiful example of chemotropic directional growth driven by ion gradients, which mirrors the ion flux changes that underlie phototropic bending in coleoptiles. Understanding those parallels strengthens your intuition for predicting directional growth in any plant tissue.
One more thing: if you want to go deeper into the cytoskeletal mechanics of how cells commit to an elongation direction, whether microtubules can grow from both ends is directly relevant. Microtubule polarity controls the orientation of cellulose synthase complexes in the cell wall, which in turn controls whether a cell elongates longitudinally or expands radially. A coleoptile that is elongating correctly has its microtubules organized transversely. Anything that disrupts that orientation (cold shock, certain herbicides, or osmotic stress) will reduce your predicted elongation and may cause radial swelling instead.
The bottom line: predicting coleoptile growth is genuinely doable with a clear framework. Set your baseline, know your growth phase, apply your environmental corrections, state a specific testable expectation before you start measuring, then track length and curvature at multiple time points and compare. When predictions miss, the table above will usually point you to the reason within one or two rounds of troubleshooting.
FAQ
How long do I have to wait to confirm that my curvature prediction is correct?
No, you should not rely on a single time point. Visible bending can lag behind the early ion and charge changes by tens of minutes, so if you measure only at the end you may think your prediction failed when the curvature had not yet become measurable. Use a short time course (for example 30, 60, 90, 120 minutes) and compare the full curve, not just the final angle.
What experimental details most often mess up phototropism predictions?
Keep the stimulus geometry consistent. If the coleoptile is not the same distance from the light source, or if the beam is angled differently, auxin redistribution strength will differ and your bending angle will shift even if intensity is the same. Mark the setup positions (distance and orientation) and rotate the setup only between replicates if you can’t keep it fixed.
If my coleoptile barely bends under light, how should I troubleshoot the prediction?
At a basic level, you can treat direction as the dominant variable and compare stimulus strength by using the same collimated-light method each run. If your light is too weak, you may predict a measurable bend but observe almost none. In that case, increase intensity, but also watch for heating from a strong lamp, because higher temperature can raise elongation rate and distort both timing and final length.
Should I worry about the initial tilt when measuring curvature angle?
Yes, but you must predict the angle changes from the right reference. If you measure from the base using a vertical reference line, a tilted initial coleoptile will change the apparent curvature angle even if the tip is behaving normally. Either start with a straight initial orientation or subtract the initial angle so all angles are reported relative to time zero.
How can I tell whether limited bending is due to biology or due to the growing medium?
Segmental analysis helps you catch it. If the base region is physically constrained by the medium (stiff agar surface, dense paper, or contact with the container), curvature may be reduced even when auxin signaling is fine. Mark and photograph at intervals, then compare tip versus base contributions, since the upper elongation zone should show the strongest auxin-driven growth.
When do nutrients start mattering for predicting coleoptile length?
That depends on what you are predicting. For days 1 to 4, the seed endosperm often supplies early requirements, so nitrogen differences usually matter less than water status and light direction. If you extend beyond the early window, nutrient limitations can reduce wall extensibility pathways, so update your constraint checklist and expect a growing mismatch with your original short-term model.
How do I design controls so they actually validate my prediction?
Control for circadian and handling effects, because length and responsiveness can change with time of day and disturbances. Measure at the same time each session and avoid moving seedlings between measurements unless your protocol requires it. Also keep the control in the same light environment minus the directional stimulus, since an unintended overall light difference can change growth rate.
My proxy for turgor shows a dip during fast growth. Does that mean growth capacity is failing?
Measure and interpret turgor carefully. A brief turgor dip during a rapid elongation burst can be a transient lag between wall expansion and water uptake, but a sustained drop suggests the yield point is not being maintained and growth will slow. If you use turgor as a proxy, look for recovery across multiple intervals, not a single minimum value.
What if one replicate grows much slower or faster than my prediction?
No, treat results as a population pattern. You should expect variability in elongation initiation timing across individuals even when you match conditions, so single “outlier” coleoptiles are not enough to reject your model. Use multiple replicates per condition, then compare your predicted trajectory to the mean and spread of the measured curves.
What visual signs suggest that microtubule or cell wall orientation disruption is breaking my model?
Yes, but only if you define the direction correctly. Auxin and wall-loosening drive elongation along the new growth axis, and cytoskeletal disruption can reduce elongation or shift it toward radial expansion. If your images show thickening or loss of longitudinal elongation, your prediction based on elongation dominance will undercount length growth and may overpredict straight, directional growth.
Next Article
What Controls When and How Fast Cells Grow and Divide
Learn what controls cell division timing and speed: checkpoints, signals, resources, DNA damage, stress, and failure lea