Microtubules grow by adding GTP-bound tubulin dimers to their plus end, and they shrink when GTP hydrolysis strips away the stabilizing cap at that tip, triggering rapid depolymerization. The whole cycle, called dynamic instability, flips between these two states stochastically, and a surprisingly thin layer of GTP-tubulin at the very tip is all that stands between a growing microtubule and a catastrophic collapse.
How Do Microtubules Grow and Shrink: Dynamic Instability

Marcus Whitmore
1 May 2026
What a microtubule actually is
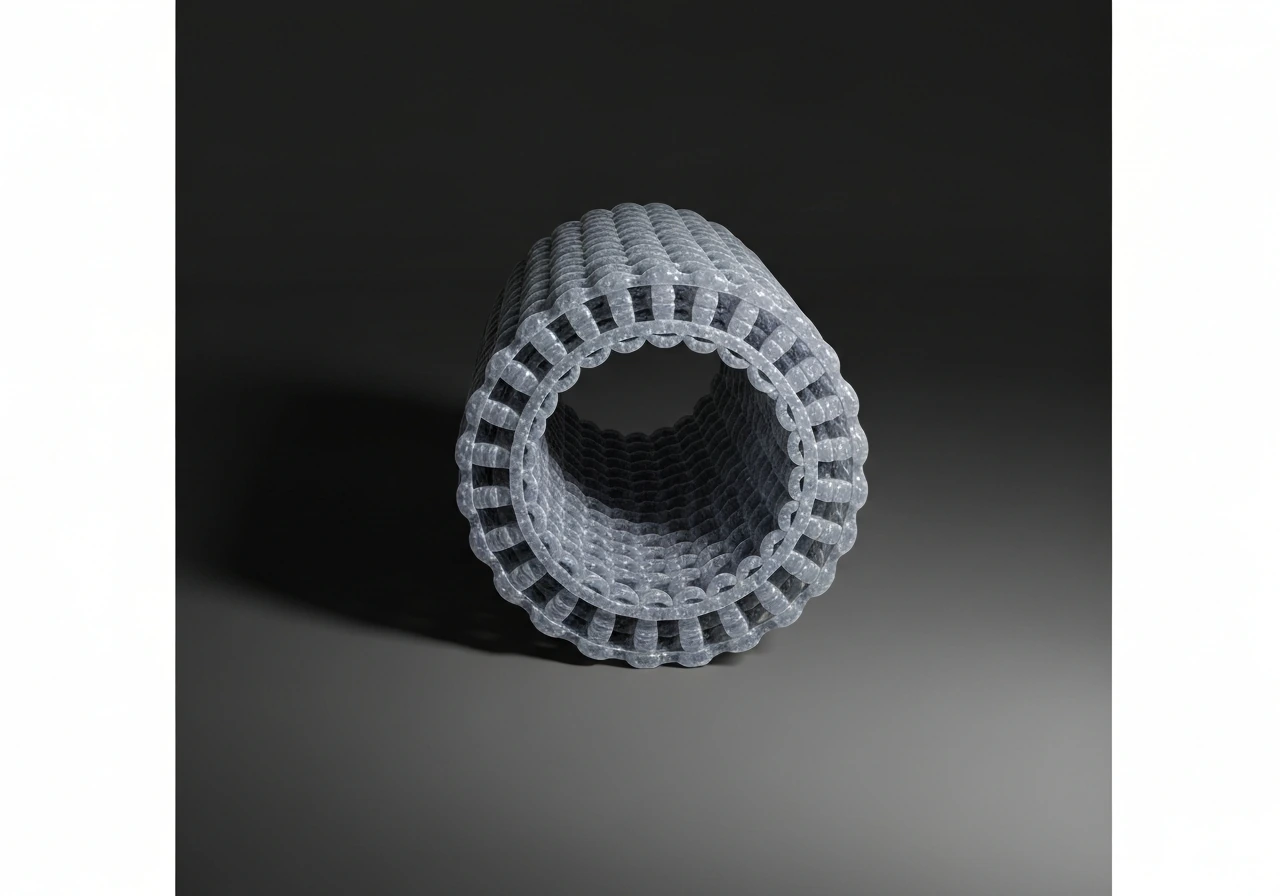
Think of a microtubule as a hollow tube built from stacked rings of protein. Each ring is made of 13 protofilaments, and each protofilament is a chain of alpha/beta-tubulin dimers stacked end-to-end. Because every dimer always orients the same way, the tube is polar: one end exposes the beta-tubulin face (the plus end) and the other exposes the alpha-tubulin face (the minus end). That polarity matters enormously because the two ends behave very differently.
The plus end grows and shrinks fast. The minus end does the same thing, but much more slowly. In cells, the minus end is often anchored or capped by proteins like the CAMSAP/Patronin family, so most of the interesting growth and shrinkage action happens at the plus end.
The defining property of microtubules is dynamic instability: a single microtubule can switch abruptly from steady growth to rapid shrinkage (catastrophe) and then, sometimes, switch back to growth again (rescue). This is not gradual thinning. Shrinkage during catastrophe is about 10 to 100 times faster than growth was. Understanding why that switch happens is the key to understanding everything else about microtubule biology.
How growth works at the plus end
Growth happens because free tubulin dimers in the cytoplasm carry GTP bound to the beta-tubulin subunit. When a GTP-tubulin dimer lands on the plus end, it fits snugly onto the existing lattice and locks into place through lateral contacts with neighboring protofilaments and longitudinal contacts with the dimer below it. GTP-tubulin dimers adopt a relatively straight conformation, which lets them pack tightly into the cylindrical wall. As long as GTP-tubulin keeps arriving faster than hydrolysis can convert it to GDP-tubulin, the plus end stays in a growth-favoring, straight-tipped configuration.
The rate of this addition scales with how much free tubulin is available. Higher tubulin concentration means more frequent dimer arrivals, faster growth, and a more robust stabilizing cap. Lower concentration slows arrivals, thins the cap, and pushes the microtubule toward catastrophe. This concentration dependence is one of the main ways cells and experimenters can tune growth behavior.
The GTP cap: why it matters and how small it really is
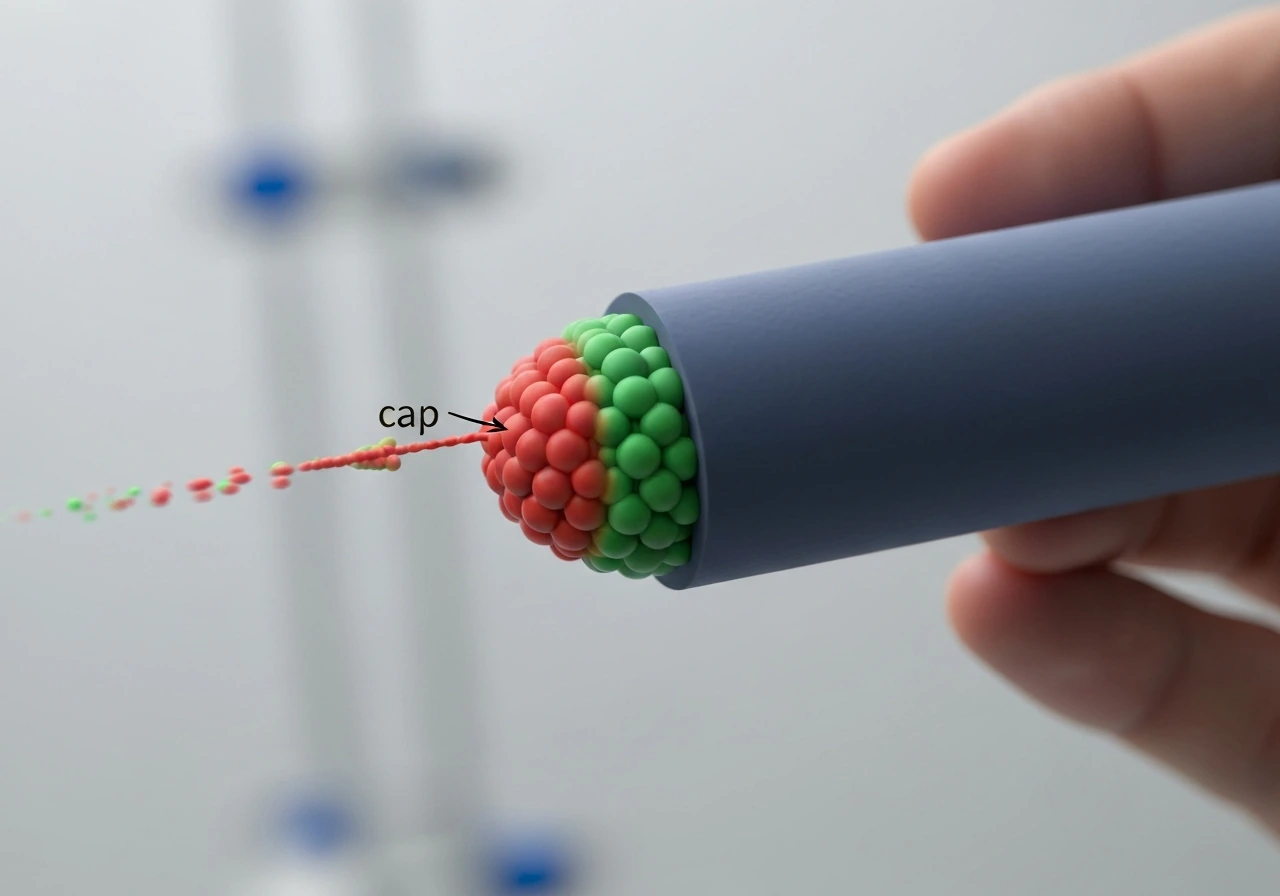
Here is where the mechanism gets genuinely surprising. As each GTP-tubulin dimer is incorporated into the wall, it eventually hydrolyzes its GTP to GDP. That hydrolysis event changes the dimer's preferred shape: GDP-tubulin wants to curve outward, away from the tube axis. Inside the lattice, surrounded by neighbors on all sides, it is forced to stay straight, but the stored mechanical stress makes the lattice intrinsically unstable. The GTP-tubulin at the very tip has not yet hydrolyzed, so it sits on top of this strained GDP lattice like a cap on a pressurized bottle.
How thick is that cap? Classic dilution experiments from the early 1990s gave a striking answer: very thin. When researchers suddenly washed away free tubulin to stop new additions, microtubules typically underwent catastrophe within about one second. That short delay implies the cap contains only a few layers of GTP-tubulin, not dozens. The cap size appears to be essentially independent of how fast the microtubule was growing just before dilution, which means that faster growth does not automatically equal a thicker, safer cap.
How shrinkage happens: catastrophe explained
Catastrophe is the abrupt transition from growth to rapid shrinkage. It happens when the GTP cap is lost, either because hydrolysis catches up with the growing tip or because new additions stop arriving fast enough to maintain it. Once the cap is gone, the strained GDP-tubulin at the tip is exposed. The curved GDP-tubulin protofilaments peel outward like the petals of a blooming flower, breaking the lateral bonds that hold the tube together, and the whole end rapidly unzips. Subunits fly off at a rate many times faster than they were added during growth.
Because GTP hydrolysis is stochastic, catastrophe is also stochastic. A given microtubule does not catastrophize at a predictable moment; instead, it has a certain probability per unit time of losing its cap. That probability is what experimenters call the catastrophe frequency, and it is measured as the number of growth-to-shrinkage transitions divided by the total time spent in growth.
One nuance worth knowing: catastrophe frequency during disassembly can behave somewhat independently of bulk free GTP-tubulin concentration under some conditions. This tells you that it is really the structural and nucleotide state of the tip itself, not just the solution around it, that drives the transition. The lattice history matters.
Rescue: switching back to growth
Rescue is the opposite event: a shrinking microtubule suddenly stops shortening and starts growing again. It is rarer than catastrophe under pure in vitro conditions, but cells actively promote it. Rescue frequency is measured as the number of shrinkage-to-growth transitions divided by the time spent shrinking. One model proposes that rescue happens when a shrinking end encounters a region of lattice that still retains some GTP-tubulin or GDP-Pi (the intermediate state between GTP and GDP), which provides just enough stability to pause the peeling and allow new GTP-tubulin to re-stabilize the tip. Lattice defects and damage-repair events may also seed rescue events inside cells.
Proteins that bias growth, catastrophe, and rescue
Cells do not leave dynamic instability to pure chance. A whole toolkit of microtubule-associated proteins (MAPs) and motor proteins push the system toward growth, catastrophe, or rescue depending on what the cell needs at that moment.
XMAP215: the growth accelerator that also promotes catastrophe
XMAP215 (and its family members, including Dis1 in yeast and ch-TOG in humans) acts like a polymerase at the plus end, delivering tubulin dimers to the tip and dramatically accelerating growth rate. In reconstitution experiments, adding XMAP215 can increase growth velocity by 5 to 10 fold. Counterintuitively, it also raises catastrophe frequency. The working model is that XMAP215 speeds up both addition and the structural maturation of the end, so the cap transitions through its states faster, increasing the probability of stochastic cap loss. In cells, XMAP215 partners with EB1 at growing plus ends, and the two together create the characteristic comet tail visible in fluorescence imaging.
CLASPs: the rescue promoters
CLASP proteins are the main anti-catastrophe, pro-rescue regulators. In vitro, adding CLASP decreases catastrophe frequency and increases rescue frequency, and it can do this without dramatically changing growth or shrinkage velocity. The mechanism involves CLASP's TOG domains recruiting tubulin dimers to the tip of a shrinking microtubule, effectively re-seeding a new cap. This makes CLASPs particularly important at places in the cell where microtubules need to survive near the cortex or at kinetochores, because a microtubule rescued from catastrophe does not have to be nucleated all over again from scratch.
Kinesin-13: the active depolymerizer
Not all catastrophe is passive. Kinesin-13 proteins (like MCAK in vertebrates) use ATP hydrolysis to actively peel GDP-tubulin protofilaments from microtubule ends, driving rapid depolymerization without needing to wait for spontaneous cap loss. Cryo-EM work shows kinesin-13 engages the curved, peeling-like protofilament conformations that characterize the shrinking end, essentially amplifying the structural instability already present in GDP-tubulin. Cells deploy kinesin-13 at kinetochores and throughout the cytoplasm to tune the catastrophe rate on demand.
EB proteins and plus-end tracking
EB1 (and EB3) are perhaps the most useful markers of growing microtubule ends because they specifically recognize the structural and nucleotide state of the GTP-cap region. EB1 binds most strongly to a transitional lattice state that is neither pure GTP nor pure GDP, meaning EB comets actually report structural maturation of the cap rather than simply GTP presence. This is practically important: EB comet length and intensity in live cells can be interpreted as a readout of how fast the cap is maturing and how stable the growing end is. EB1 also recruits other plus-end tracking proteins (+TIPs) including CLIP-170, meaning that the entire plus-end regulatory network depends on EB1 as an organizing scaffold.
What controls whether growth or shrinkage wins
Four categories of conditions set the balance between growth and catastrophe. Microtubule dynamics are commonly parameterized by growth rate (velocity), shrinkage rate (velocity), catastrophe frequency, and rescue frequency growth rate, shrinkage rate, catastrophe frequency, and rescue frequency. Understanding them helps you predict how changing one variable will shift microtubule behavior.
| Condition | Effect on growth | Effect on catastrophe |
|---|---|---|
| High free tubulin concentration | Faster addition, thicker cap | Lower catastrophe frequency |
| Low free tubulin concentration | Slower addition, thinner cap | Higher catastrophe frequency |
| GTP availability / GTP:GDP ratio | More GTP-tubulin available for addition | Lower catastrophe when GTP is abundant |
| Mg2+ concentration | Required for GTP-tubulin stability and addition | Affects hydrolysis rate and catastrophe kinetics |
| High ionic strength | Can weaken lateral contacts between protofilaments | Destabilizes lattice, may increase catastrophe |
| Molecular crowding in cells | Can concentrate tubulin locally and alter diffusion | May suppress or promote catastrophe depending on context |
The nucleotide state is the most direct driver. GTP-tubulin is straight and sticky; GDP-tubulin is curved and wants to peel. As these ends repeatedly gain and lose the nucleotide and structural states that drive peeling, they weave webs as they grow GTP-tubulin is straight and sticky; GDP-tubulin is curved and wants to peel. The ratio of GTP-tubulin to GDP-tubulin in the pool sets how often stabilizing subunits arrive versus how often the cap can be breached. Cells maintain a large pool of soluble GTP-tubulin partly for this reason: it keeps microtubules in a growth-competent state by default, and active regulation then decides when catastrophe is triggered.
Ionic conditions, especially Mg2+ and total ion concentration, matter more than is often appreciated. Divalent cations influence the geometry of GTP binding and the rate of hydrolysis, meaning that in vitro results can shift noticeably between labs simply because of buffer composition differences. This is one reason why reconstitution experiments need careful standardization to be comparable across labs.
How researchers actually measure all of this
In vitro TIRF reconstitution assays
The standard lab approach is Total Internal Reflection Fluorescence (TIRF) microscopy using a reconstituted system. Short GMPCPP-stabilized microtubule seeds (GMPCPP is a slowly hydrolyzable GTP analog that keeps the seeds stable) are immobilized on passivated glass. You then flow in fluorescently labeled soluble tubulin plus GTP, and watch dynamic extensions grow from the seed ends in real time. The system is clean enough that you can add back individual MAPs one at a time and measure exactly how each one changes the dynamics.
From those movies, you extract four core parameters using kymographs (space-time plots where the x-axis is position along the microtubule and the y-axis is time). The standard definitions are:
- Growth velocity (vg): how fast the plus end extends, in micrometers per minute
- Shrinkage velocity (vs): how fast the end depolymerizes during catastrophe
- Catastrophe frequency (fc): number of growth-to-shrinkage transitions divided by total time spent growing
- Rescue frequency (fs): number of shrinkage-to-growth transitions divided by total time spent shrinking before reaching the seed
Washout (dilution) experiments are a classic add-on to TIRF assays. Once a microtubule is growing, you abruptly flush away free tubulin. The microtubule keeps growing for a brief moment while the existing cap decays, then undergoes catastrophe. The distribution of that delay time tells you about cap size and decay kinetics. Short mean delays (around 1 second) are direct evidence that the stabilizing cap is thin.
Live-cell imaging
In cells, the most informative approach is to fluorescently tag EB1 or EB3 and watch the growing comets in real time. Because EB1 specifically binds the GTP-cap-associated structural state, comet length and brightness are a proxy for cap health. Longer, brighter comets suggest a more stable growing end; short or flickering comets precede catastrophe. Combining EB1 imaging with tracking of a second marker (like CLIP-170 or XMAP215) can reveal how the plus-end protein network responds to changes in tubulin availability or MAP activity.
High-resolution nanoscale imaging of EB1 distributions in interphase cells has shown that the comet shape reflects maturation transitions happening at the growing tip on the timescale of seconds. In a review, fluorescent imaging of EB caps is described as a way to correlate cap stability and maturation with dynamic-state fluctuations at dynamic microtubule ends (catastrophe and rescue) EB1 distributions in interphase cells. Faster maturation correlates with shorter cap lifetime and higher catastrophe probability, giving you a mechanistic readout from a simple fluorescent marker. If you want to investigate how a specific MAP or drug shifts microtubule behavior in living cells, measuring changes in EB1 comet length, density, and dynamics is often the most direct readout available.
Connecting microtubule dynamics to broader growth logic
Dynamic instability is not just a molecular curiosity. It is the physical mechanism that lets cells search space efficiently, build the mitotic spindle, and position organelles. A microtubule that only grew would be rigid and eventually trapped. A microtubule that only shrank would disappear. The switching behavior, biased by MAPs and tubulin concentration, lets a cell probe its interior rapidly and then commit resources to whichever direction finds a target. It is the same logic as adaptive growth in any biological system: explore, then exploit.
Tubulin concentration sets a hard physical limit on how fast and how stably microtubules can grow, just as nutrient availability limits cell growth or water availability limits plant elongation. In the same way, models of dynamic instability can help predict how the coleoptile will grow from where microtubule growth is promoted or suppressed. When tubulin is scarce, the GTP cap thins, catastrophe dominates, and the microtubule network collapses. This is why dividing cells upregulate tubulin expression before mitosis and why drugs like taxol (which stabilizes the GDP lattice) or vinblastine (which sequesters tubulin) can so effectively disrupt the spindle: they shift the growth-catastrophe balance far from the narrow window where useful dynamics occur. The same principle applies when thinking about how the plus end differs from the minus end, or why certain cell types with unusually long microtubules (like neurons) require especially robust CLASP and XMAP215 activity to keep those structures from catastrophizing before they reach their targets.
If you are exploring related aspects of cellular growth and dynamics, the mechanics of how microtubules grow from their two ends and whether both ends contribute to elongation are closely tied to everything discussed here. The end-specific behaviors described in this article also connect to how plant cells orient their cortical arrays and guide directional growth, since the same dynamic instability rules govern how plant microtubules organize themselves in response to developmental cues. In pollen tubes, the same type of tip-focused growth is promoted by signals that stimulate the cytoskeleton to keep polymerizing at the front, which helps answer what stimulates the pollen tube to grow plant cells orient their cortical arrays and guide directional growth. In plant systems, that same dynamic instability framework lets researchers predict how the coleoptile will grow over time.
FAQ
Why do microtubules sometimes keep growing for a bit after I remove free tubulin in vitro?
Even after washout, the plus end already has an existing GTP-cap. The microtubule continues to add dimers only until that cap decays, or until hydrolysis outpaces any remaining additions. The delay time distribution after washout reflects cap decay and can be short, around a second, indicating only a few layers of GTP-tubulin were protecting the tip.
Does a faster growth rate automatically mean the cap is thicker and catastrophe is less likely?
Not necessarily. Experiments show that cap thickness, inferred from washout delays, can be largely independent of the growth speed right before dilution. This means that “cap safety” depends on the detailed maturation state and dynamics of the tip, not just on how rapidly tubulin was arriving moments earlier.
What is the most common mistake when interpreting EB1 comet length as “how much GTP is present”?
EB1 reports a transitional structural state associated with cap maturation, not a simple “all GTP” versus “all GDP” readout. So comet length and intensity are better interpreted as tip structural/nucleotide maturation health, not as direct measurement of absolute nucleotide composition.
Why can catastrophe frequency change without a big change in the bulk GTP-tubulin concentration?
Catastrophe can be sensitive to the local nucleotide and structural history of the lattice at the end. If the tip has more GDP-Pi-like intermediate or retains stabilizing elements from prior growth, it can pause before peeling even when the surrounding soluble nucleotide pool looks similar. This is why end-state matters more than bulk conditions in some scenarios.
How do Mg2+ and buffer composition complicate comparing microtubule dynamics between labs?
Divalent cations, especially Mg2+, influence GTP binding geometry and the kinetics of hydrolysis. Small differences in total ionic strength or Mg2+ concentration can shift growth, catastrophe frequency, and rescue behavior enough that “same tubulin concentration” results may not match across experiments.
In TIRF reconstitution, what determines whether I see frequent rescues versus mostly catastrophe?
Rescue depends on local lattice conditions at the shrinking end and on whether a stabilizing region can be encountered or rebuilt before the end fully unzips. In practice, it is strongly affected by the presence of rescue-promoting MAPs like CLASP and by how the experimental system prepares seeds and solute composition (including nucleotide state).
Do XMAP215-like proteins always reduce catastrophe because they increase growth?
No. XMAP215 family proteins can increase catastrophe frequency even while strongly boosting growth velocity. The working idea is that they accelerate both addition and maturation dynamics, which can increase the probability that the tip transitions through unstable states where cap loss can occur.
What is the difference between spontaneous catastrophe and kinesin-13-driven depolymerization?
Spontaneous catastrophe happens when the cap is lost stochastically as hydrolysis and arrival rates let protection fail. Kinesin-13 actively promotes depolymerization by using ATP to peel curved, peeling-prone protofilament conformations, effectively accelerating shrinkage without waiting for a cap to decay on its own.
Why are rescue events rarer in pure in vitro assays than in cells?
In cells, multiple regulatory factors actively maintain or re-create stabilizing tip states during shrinkage. In contrast, many minimal in vitro setups lack the specific MAP networks that re-seed a new cap during shortening, so the shrinking end often unzips to completion.
What should I measure if I want to tell whether a drug changes cap stability versus changing tubulin supply?
Track both a cap-associated marker and the kinetics of transitions. In living cells, EB1 comet metrics (length, density, dynamics) are informative for cap stability, while transition counts give you catastrophe or rescue frequency. In vitro, combine growth/shrinkage velocities with washout delay distributions to separate cap decay changes from altered addition rates.
Do plus ends and minus ends show the same growth and shrinkage behavior?
No. The plus end typically shows much faster dynamic instability, while the minus end is usually slower and is often stabilized or anchored by proteins like CAMSAP or Patronin. As a result, most experimentally and biologically relevant switching is concentrated at the plus end.
If I see a microtubule switch from shrinkage to growth, how can I tell whether it is true rescue versus re-growth from a different site?
Confirm that the same physical end resumes elongation rather than a new lattice fragment forming. In TIRF, this is usually checked by following the position of the shrinking front over time in kymographs. In cells, co-tracking an end marker like EB1 helps ensure that the resumed growth corresponds to the original plus end tip state.
Next Article
What Stimulates the Pollen Tube to Grow Step by Step
Learn what stimulates pollen tube growth step by step: hydration, compatibility cues, and chemical gradients that drive