Microtubules grow by adding tubulin protein subunits one by one onto their plus end, the faster-growing tip that sticks out toward the cell's periphery. That's the short answer. But the interesting part is what keeps that growth going, what stops it, and what makes the whole system so deliberately unstable. Understanding microtubule growth means understanding a cycle of building and tearing down that the cell uses on purpose, not as a flaw.
How Do Microtubules Grow: Plus-End Growth and Dynamic Instability

Marcus Whitmore
18 Apr 2026
Microtubule basics: polarity and ends
A microtubule is a hollow tube about 25 nanometers wide, built from repeating units of αβ-tubulin dimers stacked end-to-end into 13 parallel protofilaments that wrap around to form the tube. Because every αβ dimer has a defined orientation, the whole structure is polar, meaning the two ends are physically different. One end exposes β-tubulin to the outside world. That's the plus end, and it grows fast. The other end exposes α-tubulin. That's the minus end, and it grows much more slowly, often not at all inside the cell.
This polarity isn't just a structural curiosity. It's the foundation for everything directional in the cell: motor proteins walk toward one end or the other, chromosomes get pulled toward specific poles during mitosis, and growth signals get transmitted spatially because one end of the microtubule is dynamically searching the cytoplasm while the other is anchored at an organizing center. In most cells, the minus end is held in place at the centrosome (or another microtubule-organizing center, MTOC), while the plus end probes outward. That means when we talk about how microtubules grow, we're mostly talking about what happens at the plus end.
What microtubule growth actually means: polymerization step by step
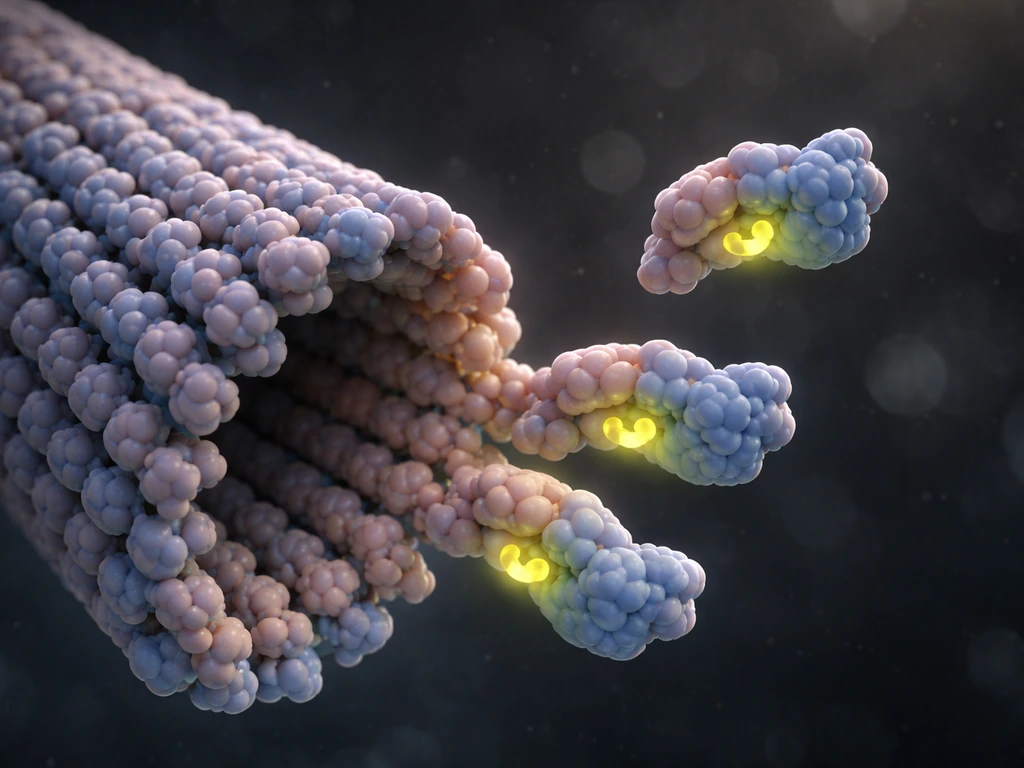
Think of tubulin dimers as bricks that are already loaded with a molecular fuel called GTP (guanosine triphosphate). In the cytoplasm, free tubulin carries GTP bound to the β-tubulin subunit. When one of these GTP-tubulin dimers encounters the plus end of a growing microtubule, it binds to the exposed β-tubulin surface, slots into the lattice alongside its neighboring protofilaments, and gets locked in place by both end-on contacts and lateral bonds with adjacent protofilaments. That addition lengthens the microtubule by about 8 nanometers.
Here's where the fuel comes in. Once a tubulin dimer is incorporated into the lattice, GTP slowly gets hydrolyzed to GDP. GDP-tubulin is mechanically different: its protofilament wants to curve outward away from the tube axis, which strains the lateral bonds holding the microtubule together. As long as new GTP-tubulin keeps arriving at the tip faster than hydrolysis can process the existing subunits, a GTP cap forms at the plus end. That straight, GTP-bound cap stabilizes the entire lattice below it. Growth continues as long as that cap is maintained.
So growth is really a race. Free tubulin in the cytoplasm adds to the end, extending the GTP cap. GTP hydrolysis works backward through the lattice, trying to catch up to that cap. Growth wins when tubulin concentration is high and addition is fast. Hydrolysis wins when addition slows down, and that's when things get precarious.
Dynamic instability: growth, catastrophe, and rescue
Microtubules don't just grow steadily and then stop politely. They switch, sometimes abruptly, between a phase of persistent growth and a phase of rapid shortening. This switching behavior is called dynamic instability, and it's one of the most important concepts in cell biology. This cap and switching behavior help explain what weaves webs as they grow, shaping how microtubule networks expand and reorganize. This behavior is part of the way microtubules grow and shrink through dynamic instability at their plus ends. The transition from growth to shrinkage is called catastrophe. The transition from shrinkage back to growth is called rescue.
Catastrophe happens when the GTP cap is lost. If hydrolysis catches up to the plus end, the stabilizing cap dissolves. The newly exposed GDP-tubulin protofilaments begin to curl outward, weakening and then breaking lateral contacts. The end peels apart and subunits peel off rapidly. Shrinkage during catastrophe can be astonishingly fast compared to growth, sometimes 5 to 10 times faster. It's not passive disassembly. The stored mechanical strain from those curved GDP protofilaments is released as the microtubule depolymerizes.
Rescue occurs when shortening suddenly stops and the microtubule switches back to growth. The exact molecular trigger is still an active research area, but it's thought to involve encountering a stabilized region in the lattice, perhaps a patch of GTP-tubulin that survived hydrolysis (sometimes called a 'GTP island'), or binding of a rescue-promoting protein. Measured in living cells, catastrophe frequency runs around 0.019 to 0.021 events per second for individual microtubules, while rescue frequency is considerably higher, around 0.109 to 0.112 events per second, which means rescues are more common once shrinkage has started.
One non-obvious detail: catastrophe probability is not constant over time. It tends to increase the longer a microtubule has been growing. This is sometimes described as a time-dependent (or aging) catastrophe model. Basically, a microtubule that has been steadily growing for a while has had more opportunity for subtle structural changes at its tip that raise the odds of a catastrophe. That's one reason microtubules don't simply grow forever: even at high tubulin concentrations, catastrophe eventually catches up.
Nucleation: how a microtubule gets started in the first place
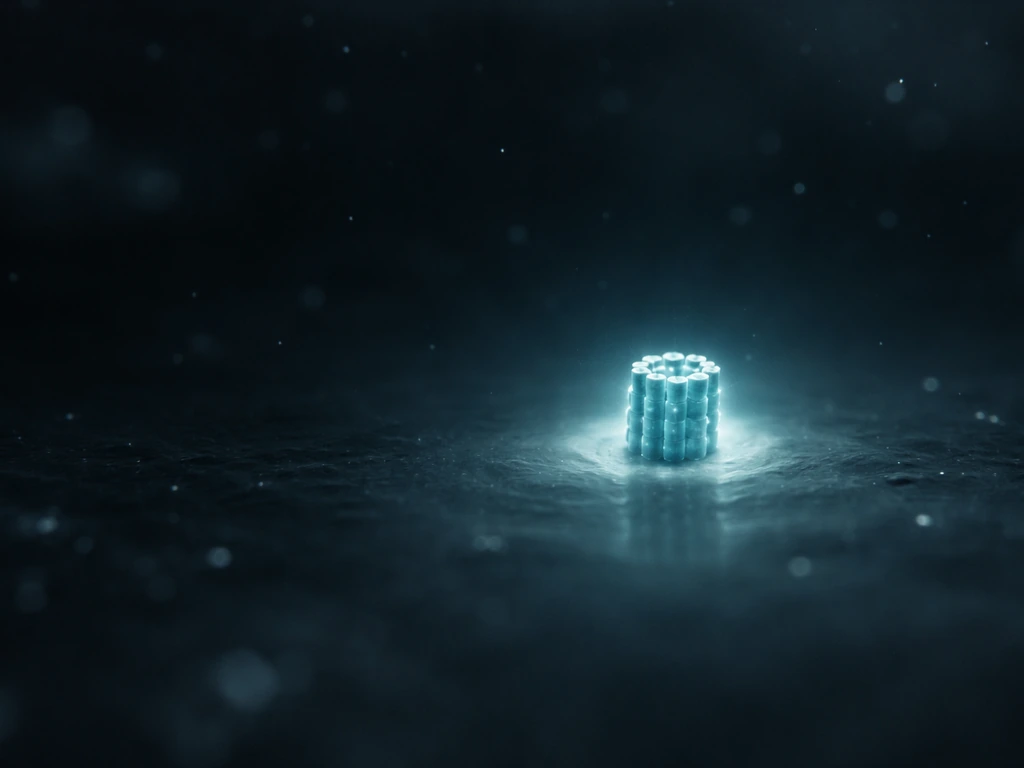
Before a microtubule can grow, it has to start. And starting is hard. Spontaneous assembly from free tubulin dimers requires a nucleus, a small oligomer stable enough not to fall apart before more subunits can join. This nucleation barrier is why you don't just get random microtubules appearing everywhere in the cytoplasm.
Cells solve this with a dedicated nucleation machine called the γ-tubulin ring complex (γ-TuRC). This ring-shaped protein complex acts as a template, presenting a circular arrangement of γ-tubulin subunits that match the geometry of the microtubule's minus end. Free αβ-tubulin dimers bind to γ-TuRC, get oriented correctly, and suddenly the minus end is pre-formed. The microtubule can then elongate from its plus end without having to overcome the nucleation barrier on its own.
γ-TuRC is concentrated at the centrosome in animal cells, which is why most microtubules radiate outward from the centrosome with their minus ends anchored there and their plus ends facing the periphery. But nucleation can also happen at other MTOCs, at the nuclear envelope, and even in the cytoplasm in certain cell types. Once a microtubule is nucleated, minus-end anchoring proteins like the CAMSAP family can bind its free minus end and stabilize it, allowing the microtubule to persist even away from a centrosome. γ-tubulin itself is also a minus-end binding protein that helps stabilize that slow end once the microtubule is formed.
What a microtubule needs to grow: conditions and limits
Growth doesn't happen in a vacuum. Several factors have to be in the right range for plus-end elongation to proceed and persist.
Tubulin availability
The single biggest driver of growth rate is the concentration of free GTP-bound tubulin in the cytoplasm. Higher free tubulin means faster plus-end elongation, a larger GTP cap, and lower catastrophe probability. At lower concentrations, the addition rate slows, the cap shrinks, and catastrophe becomes more likely. Studies measuring growth rate variability across roughly a 2-fold range of tubulin concentration show that this parameter has an outsized effect on instability dynamics compared to secondary factors. In practical terms, this means cells regulate the size of their free tubulin pool, partly by controlling how many microtubules are present (since every growing microtubule consumes free tubulin), to tune overall dynamics.
Compartment size and crowding
Here's something that surprises students: the size of the compartment matters. In small compartments (roughly less than 100 μm³), microtubule growth and catastrophe behavior measurably diverge from what you see in large, open conditions. Why? Because a growing microtubule is consuming free tubulin from a limited pool. In a small compartment, that consumption noticeably depletes local tubulin concentration, which then slows growth and raises catastrophe frequency. In a large cell or in a test tube with excess tubulin, this depletion is negligible. The cytoplasm's viscosity and molecular crowding also modulate how fast tubulin diffuses to the plus end and how quickly depolymerization proceeds.
Ionic conditions
Monovalent ions in the cytoplasm affect catastrophe probability and lattice stability. Changes in salt concentration shift the balance of lateral and longitudinal contacts within the microtubule wall, subtly changing tip structure and the probability of end peeling. This is why in-vitro reconstitution experiments have to be done in buffers that mimic physiological ionic conditions to get biologically relevant dynamics.
Competition among plus ends
When a dense array of microtubule plus ends is present, each one competes for the same pool of free tubulin. This collective competition means the addition rate per microtubule drops as network density increases, and the system reaches a kind of steady state where the total amount of polymer is limited by the tubulin budget. It's a natural brake on unlimited growth.
How proteins regulate growth vs. shrinkage
The cell doesn't leave dynamic instability to chance. A large cast of regulatory proteins targets microtubule ends to shift the balance between growth and catastrophe in specific places and at specific times.
| Protein/Family | Where it acts | What it does to dynamics | Net effect on growth |
|---|---|---|---|
| EB1/EB3 (end-binding proteins) | GTP-cap region at plus end | Bind preferentially to GTP-tubulin; report cap presence; recruit other regulators | Promotes growth persistence |
| XMAP215/Dis1 family | Plus end | Accelerates tubulin addition; at high activity can also disrupt end structure and promote catastrophe | Generally promotes growth; context-dependent |
| MCAK (kinesin-13) | Plus and minus ends | Stimulates end peeling; increases catastrophe frequency, reduces microtubule number | Promotes shrinkage/catastrophe |
| CLASP family | Plus end and lattice | Stabilizes pre-catastrophe intermediate; suppresses catastrophe and promotes rescue | Suppresses catastrophe, promotes rescue |
| γ-TuRC | Minus end / MTOC | Templates nucleation; stabilizes minus end; proposed roles in modulating plus-end catastrophe | Enables nucleation; stabilizes minus end |
| CAMSAP family | Free minus ends | Anchors and stabilizes minus ends away from centrosome | Stabilizes minus end; allows persistent growth from plus end |
EB proteins are worth highlighting because they're both sensors and scaffolds. CLIP-170 is a plus-end tracking protein, and mechanistic work links plus-end tracking behavior to the GTP-cap/protofilament-depth models and EB1/GTP-cap recognition. They bind tightly to the GTP-cap region, so their comet-like appearance at plus ends in live imaging directly reports cap presence and growth state. They also recruit other plus-end tracking proteins (+TIPs) that can either stabilize or destabilize the end depending on context. In that sense, EB proteins are the hub of a plus-end regulatory network.
MCAK (a kinesin-13 family member) is a well-studied destabilizer. It uses ATP hydrolysis to walk to plus ends and physically peel protofilaments apart, dramatically increasing catastrophe frequency. Overexpressing MCAK reduces the total number of microtubules in a cell, while depleting it shifts the balance toward longer, more stable microtubules. Its kinesin-13 relatives behave similarly: in experiments where kinesin-13 was depleted, shrinkage rate and rescue frequency increased while catastrophe frequency and growth rate dropped, showing how intertwined these parameters are.
CLASP proteins occupy the opposite corner. They specifically suppress catastrophe by stabilizing an intermediate state that the plus end passes through just before committing to rapid shortening. When CLASPs are active, microtubules that would otherwise catastrophize instead pause or rescue. This makes CLASPs especially important in regions of the cell where sustained microtubule contact is needed, like the cell cortex or kinetochore attachments during mitosis.
How to measure growth and predict what will happen
If you want to study microtubule growth, whether you're running your own experiments or interpreting published data, there are a handful of core readouts and mental models that will take you a long way.
Life history plots and kymographs
The workhorse readout is the length-vs-time trace, sometimes called a life history plot. You track the position of a microtubule's plus end over time (from fluorescent tubulin in live cells, or from EB3-GFP comets) and plot length against time. Phases of steady upward slope are growth. Phases of rapid downward slope are catastrophe and shrinkage.
Flat segments are pauses. From these traces, you can compute growth velocity (slope during growth), shrinkage velocity (slope during shrinkage), catastrophe frequency (1 divided by the mean time spent growing before a catastrophe), and rescue frequency (1 divided by the mean time spent shrinking before a rescue). Kymographs, which are space-time plots extracted from time-lapse movies, display the same information in a visually intuitive format and can reveal individual switching events even in dense cytoplasm.
EB comet assays
Fluorescently labeled EB1 or EB3 forms bright comets at growing plus ends because it binds the GTP-cap region. EB1 preferentially binds GTP-tubulin at growing microtubule tips, producing comet-like tip tracking that reports the presence of the GTP cap binds the GTP-cap region.
In live imaging, these comets are visible as bright puncta sweeping outward. Their density and speed report both growth rate and the number of actively growing plus ends in the field of view. Advanced analysis can classify comet morphology: a clean, sharp comet indicates a healthy GTP cap, while split or curled comets indicate end structure disruption that predicts imminent catastrophe.
This makes EB comet assays one of the most practical tools for monitoring how perturbations (drug treatments, protein overexpression, knockdowns) affect plus-end dynamics in real time.
Predicting how conditions will shift dynamics
Once you understand the GTP-cap model and the regulatory landscape, you can reason through expected outcomes for common perturbations. Thinking it through as a mental checklist is genuinely useful: Thinking it through as a mental checklist is genuinely useful, including how you can predict how the coleoptile will grow from expected shifts in plus-end dynamics.
- Increase free tubulin concentration: growth rate goes up, GTP cap gets larger on average, catastrophe frequency drops, mean microtubule length increases.
- Add a destabilizer like MCAK: catastrophe frequency rises sharply, mean microtubule length drops, rescue frequency may also change depending on mechanism.
- Add a stabilizer like taxol (or overexpress CLASP): catastrophe is suppressed, GDP-lattice is stabilized chemically or biologically, microtubules become longer and less dynamic.
- Deplete γ-TuRC: nucleation at the centrosome fails or is severely reduced, fewer microtubules form even if free tubulin is plentiful, and cellular organization (like the mitotic spindle) collapses.
- Reduce compartment volume or increase crowding: local tubulin depletion raises catastrophe frequency; dynamics become more variable and potentially slower.
- Change ionic conditions (raise or lower salt): alters lateral bond strength, shifts tip structure, changes catastrophe probability in a direction that depends on the specific ion and concentration.
What to look for in real experiments
In a live-cell experiment, the most informative first look is the EB3 comet density and average comet velocity. Dense, fast comets mean lots of active growth and a high free-tubulin pool. Sparse or slow comets suggest either low tubulin availability, elevated catastrophe frequency, or both. If you see very few comets but microtubule polymer is still present (detectable by total tubulin staining), that usually means microtubules are stabilized (large GTP cap or stabilizing drugs) rather than actively growing. If comets are present but short-lived, catastrophe frequency is high.
For students building a mental model: the core question to ask about any microtubule growth scenario is always 'what is happening to the GTP cap?' Is the cap being extended (fast addition, high free tubulin, stabilizing proteins)? Or is it being eroded (slow addition, destabilizers, hydrolysis catching up)? Everything else, catastrophe frequency, mean length, rescue rate, sensitivity to drugs, follows from the answer to that question.
Connecting growth to the bigger picture of cell biology
Microtubule growth is not just a structural exercise. The same dynamic instability that makes individual microtubules seem unstable gives the cell incredible spatial flexibility. A microtubule that shrinks and re-grows can search a new region of the cytoplasm in seconds. During mitosis, this 'search-and-capture' mechanism is how spindle microtubules find chromosomes: they grow outward, catastrophize if they miss, and try again from a different angle until they capture a kinetochore.
This overall idea helps explain what stimulates the pollen tube to grow, since growing tips rely on signals that promote safe plus-end extension. The balance of growth and catastrophe is calibrated differently in different parts of the cell and at different points in the cell cycle, which is a testament to how tightly regulated this process is.
This same plus-end logic and the need for a stabilizing cap as conditions shift is also the kind of mechanism that can explain what stimulates the pollen tube to grow. If you're curious about how a pollen tube extends its tip, the same idea of tip growth and controlled plus-end behavior is a helpful comparison point when you look at how does the pollen tube grow down the style pollen tube to grow.
It's also worth noting that microtubules can grow from both ends under the right conditions, though the asymmetry in growth rates means plus-end behavior dominates most cellular contexts. And the growth-shrinkage relationship described here connects directly to broader questions about how cells manage length, polymer mass, and spatial organization, themes that run through many aspects of how cells and organisms grow and reach their limits.
FAQ
Do microtubules only grow at the plus end, or can they grow at both ends?
In most animal-cell contexts, the minus end is anchored at the centrosome or another MTOC, so most measured “growth” is plus-end elongation. Minus ends can still polymerize under special conditions, but their intrinsic elongation is much slower, so cells usually appear plus-end dominated when you watch dynamics.
What exactly is the GTP cap, and how do you know when it is present?
The “GTP cap” is easiest to interpret as a population of GTP-tubulin near the tip that is continuously replenished. If additions slow or hydrolysis catches up, the cap disappears and catastrophe follows. In practice, you infer cap state indirectly from end-probe behavior such as EB comets, not by measuring the cap directly in living cells.
Does the chance of catastrophe stay constant over time while a microtubule is growing?
Catastrophe probability is not uniform, it tends to rise with how long the microtubule has been growing. That means a long-lived growing segment is inherently closer to failure than a newly started one, even if overall tubulin concentration stays the same.
Why do microtubule dynamics change in small volumes or confined spaces?
Cytoplasmic depletion is most important in limited-volume conditions, because tubulin added to one plus end is not immediately replaced from far away. In vitro assays with small chambers or crowded setups can show faster-than-expected shifts in growth, rescue, and catastrophe when the free tubulin pool declines during the experiment.
If increasing tubulin speeds microtubule growth, why can the overall system still become less stable?
High tubulin concentration generally increases growth velocity and cap size and lowers catastrophe frequency, but it can also change outcomes by increasing the number of competing growing ends. More ends consume more free tubulin total, so network-level behavior may look different than what you’d predict from one filament growing in isolation.
If I see few or no EB3 comets, does that always mean microtubules are not growing?
EB3 comets are a practical readout for actively growing plus ends, but comet visibility depends on probe expression, imaging settings, and whether the tip has a functional GTP-rich region. A lack of comets can reflect poor imaging or suppressed plus-end activity, so it is safer to corroborate with total polymer (for example, total tubulin staining) when interpreting results.
Why is microtubule shrinkage often much faster than growth?
When catastrophe happens, shrinkage accelerates because GDP-bound protofilaments prefer to curve outward, weakening lateral bonds and allowing rapid peeling. That is why shrinkage often appears much faster than growth, and why the same microtubule can undergo dramatic length loss after a relatively brief cap collapse.
How does rescue occur after a microtubule starts shrinking?
A rescue is not simply “cap comes back” at random, it involves switching from disassembly to renewed elongation. Mechanistically, rescue can be promoted by stabilized lattice regions that survive hydrolysis, often described as GTP islands, and by end-binding proteins that favor the next growth phase.
What roles do γ-TuRC and minus-end anchoring proteins play in enabling plus-end growth?
You need to consider nucleation and minus-end anchoring separately. γ-TuRC primarily lowers the nucleation barrier at an MTOC so microtubules can start with correctly oriented minus ends, while minus-end binding proteins help keep the slow end anchored so the microtubule persists and can keep probing outward.
How do EB proteins, MCAK, and CLASP each change microtubule growth in practice?
Yes, regulatory proteins can shift the balance by altering how easily the tip loses lateral cohesion or commits to rapid depolymerization. Stabilizers like CLASP reduce catastrophe propensity, while destabilizers like kinesin-13 family members actively promote protofilament peeling, so you should expect different changes to comet behavior, growth time distributions, and catastrophe timing.
How can I use length-time traces and comet data to tell whether a perturbation mainly changes cap maintenance versus tubulin supply?
If a treatment increases catastrophe frequency without changing growth velocity much, that often points to tip destabilization that makes the GTP cap harder to maintain. If it reduces growth velocity and comet density, that suggests lower effective free-tubulin availability or impaired delivery to the plus end.
Next Article
Predict How the Coleoptile Will Grow: A Step-by-Step Method
Step-by-step method to predict coleoptile length and curvature by linking auxin, turgor, and light to measurable growth