Most human cells take somewhere between 10 and 24 hours to complete one full cell cycle under normal conditions, but that range barely scratches the surface. Gut lining cells can divide every 12 hours. Human T lymphocytes clock in around 16.6 hours. A generic cultured human cell runs about 24 hours. Some slow-turnover cells stretch their cycle over days, and mature neurons essentially never divide at all. The speed depends heavily on the cell type, the tissue context, the available nutrients, and a series of internal checkpoints that act like quality-control gates. If you want a number for a specific cell type, the sections below will help you find or measure it.
How Fast Do Cells Grow? Typical Rates and What Controls Them

Marcus Whitmore
6 May 2026
Growth vs. Division: They're Not the Same Thing
This distinction trips people up constantly, so let's settle it first. "Cell growth" technically means a cell increasing its size and biomass, not a cell dividing into two daughters. A cell grows during interphase, the long stretch between divisions that includes G1 (gap 1), S phase (DNA replication), and G2 (gap 2). Mitosis itself, the M phase, is relatively short and is really about splitting the already-grown, already-duplicated cell in two.
When people ask "how fast do cells grow?", they usually mean one of three things: how quickly does a single cell get bigger, how fast does a cell complete one cycle and divide, or how fast does a population of cells expand in number. Cells grow in number by dividing into two daughter cells. Those are related but distinct questions, and the answer to each can be very different. A cell can grow steadily in size for 20 hours before division takes just 1 to 2 hours to wrap up. Population-level expansion, tracked as doubling time, is what most labs actually measure in practice.
Real Time Ranges for Different Cell Types
Here's where the concrete numbers live. The full cell cycle is divided into G1, S, G2, and M phases, and the timing of each phase varies a lot depending on the cell type. S phase (DNA synthesis) usually runs 2 to 9 hours. G2 is typically 2 to 6 hours. Mitosis itself takes about 1 to 2 hours. The wildly variable piece is G1, which can last anywhere from about 7 hours in actively dividing cultured cells to days in slow-cycling tissues. Nearly all of the variation you see between fast and slow cells comes down to how long they spend in G1 (or parked in the quiescent G0 state).
| Cell Type | Approximate Cycle Time | Notes |
|---|---|---|
| Chinese hamster lung cells (culture) | ~10 hours | One of the faster-cycling mammalian cells studied |
| Human T lymphocytes (stimulated) | ~16.6 hours | Measured using CFSE-based proliferation tracking |
| Intestinal crypt transit-amplifying cells | 12 to 16 hours | Divide ~5 rounds before differentiating; produce ~300 cells/crypt/day |
| Intestinal crypt stem cells | ~24 hours | Cycle roughly once per day |
| Colon epithelial cells | ~25 hours | Representative measured value |
| Stomach epithelial cells | ~24 hours | G1 ~9 h, S ~12 h, G2+M ~3 h |
| Generic cultured human cell | ~24 hours | Approximate average across culture conditions |
| Cancer ascites cells | ~113 hours | Much longer G1 drives the extended cycle |
| Basal keratinocytes (skin) | Days to weeks | Full epidermal turnover every 40 to 56 days |
| Adult neurons | Essentially never | Postmitotic; re-entry into the cycle is atypical and often triggers apoptosis |
Red blood cells deserve a special mention because they illustrate an extreme: mature erythrocytes have no nucleus and literally cannot divide. Their precursors (reticulocytes) mature in the bone marrow over about 24 to 48 hours, then circulate for another ~24 hours before becoming fully mature RBCs. Red blood cell precursors mature in the bone marrow and then develop into fully mature red blood cells after circulating for about a day do red blood cells grow. That's a maturation process, not a cell cycle. It's a good reminder that not every cell in your body is playing by the same rulebook.
What Actually Controls How Fast a Cell Grows
Think of cell growth speed as the output of several competing inputs. Nutrients, energy, signaling molecules, and internal checkpoints all feed into the same decision: keep going, slow down, or stop. Here's how each one plays its role.
Nutrients and Energy
A cell can't grow if it doesn't have raw materials. Amino acids, glucose, and oxygen are the critical inputs. The protein complex mTORC1 acts as the cell's main nutrient sensor, integrating signals about amino acid availability and growth factor levels to decide whether conditions are good enough to commit to growth and division. Starve a culture of amino acids and the cells stall in G1. Restore those amino acids and they can re-enter the cycle in as little as 2 hours. Compare that to serum-deprived cells (growth factor withdrawal), which can take about 12 hours to re-enter. That difference alone tells you that nutrient sensing and growth-factor signaling are separate, layered control mechanisms.
Growth Factor Signaling and the Restriction Point
Before a cell commits to DNA replication, it passes through what's called the restriction point in G1. Up until that point, remove the growth factors and the cell retreats to quiescence. Past it, and the cell is committed regardless of what happens outside. The molecular machinery behind this involves cyclin D activating CDK4/6, which starts phosphorylating the Rb protein. Cyclin E and CDK2 finish the job, fully releasing the transcription factor E2F and letting the cell push into S phase. This sequential phosphorylation cascade is essentially the cell's internal clock for G1 progression.
Cell Size Checkpoints
Cells don't just divide whenever the clock says so. There are checkpoints that verify the cell has actually grown enough to divide. If a cell hasn't accumulated sufficient biomass, it waits. This is part of why G1 length is so variable: cells that grow slowly spend more time there before they're big enough to proceed. It's a quality-control gate, not just a timer.
DNA Damage Checkpoints
The cell also monitors its own DNA for damage throughout the cycle. The p53 protein is a central player here: it can trigger arrest at the G1/S boundary (stopping the cell before replication) or at the G2/M boundary (stopping it before mitosis) if damage is detected. This isn't the cell being slow; it's the cell being careful. A cell that rushes through replication with broken DNA is a cell that passes mutations to its daughters.
Why Cell Growth Can't Go On Forever
Every biology student eventually asks: if cells can keep dividing, why don't they? There are at least three distinct braking systems that prevent unlimited expansion in healthy tissue. In vitro, normal human diploid cells eventually stop dividing at roughly 50 to 70 population doublings, a behavior often referred to as the blank" rel="noopener noreferrer">Hayflick limit (BiONumbers). ScienceDirect Topics describes the Hayflick limit as the finite number of divisions for human diploid cells before growth arrest or senescence blank" rel="noopener noreferrer">braking systems that prevent unlimited expansion in healthy tissue.
- Contact inhibition: When normal cells become densely packed and touch their neighbors, they stop proliferating. This involves both direct cell-cell contact and local depletion of growth factors in the surrounding fluid. CDK inhibitors like p27 and p16 rise as density increases, effectively applying the brakes. Cancer cells often lose this response, which is a big part of why tumors grow when normal tissue wouldn't.
- Cellular senescence (the Hayflick limit): Normal somatic cells can only divide a finite number of times before they enter a permanent state of arrest called senescence. This is driven by telomere shortening and involves the same p53 and CDK inhibitor networks that govern checkpoint responses. A senescent cell is metabolically active but can't divide.
- Diffusion and transport limits: A cell can only get so large before the surface-area-to-volume ratio becomes a problem. Nutrients and oxygen diffuse in from the outside, and waste products need to diffuse out. A cell that grows too large can't supply its core fast enough. This is a pure physical constraint, not a genetic one, and it's one of the reasons why single cells stay small relative to the whole organisms they build.
How to Measure Cell Growth Rate in Practice
If you need an actual number for a specific cell type, here are the methods researchers actually use. Each one measures something slightly different, so knowing what you're really asking is step one.
Doubling Time from Cell Counts
The simplest approach: count your cells at two time points during exponential growth and apply the formula doubling time = t × ln(2) / ln(N2/N1), where t is elapsed time and N1 and N2 are cell counts. This gives you population doubling time, which reflects both the cell cycle duration and the fraction of cells actively dividing. It doesn't tell you what phase is slow or fast, just the overall rate.
BrdU and EdU Pulse Labeling with Flow Cytometry
To break the cycle down by phase, you use nucleoside analogs like BrdU (bromodeoxyuridine) or EdU (ethynyldeoxyuridine). These are synthetic DNA building blocks that get incorporated during S phase. A short pulse labels the cells in S phase at that moment; then you chase with unlabeled medium and use flow cytometry to watch that labeled cohort move through G2 and into G1 over time. By tracking when the labeled population exits G2+M and when the leading edge re-enters S phase, you can calculate S-phase duration, G2+M duration, and from those derive the total cycle time. Dual EdU/BrdU pulse-chase protocols can be especially precise because you can mark two separate cohorts and compare their positions.
CFSE Dilution for Proliferation Tracking
CFSE (carboxyfluorescein succinimidyl ester) is a dye that binds to proteins and gets diluted in half with every division. Label your cells once, then follow the fluorescence intensity by flow cytometry over time. Each division produces a new, dimmer generation peak. From the distribution of intensities, you can estimate how many divisions have occurred and back-calculate the average doubling time. This is the method used to derive the ~16.6-hour T lymphocyte cycle time mentioned earlier.
Ki-67 as a Proliferation Index
Ki-67 is a protein that's present throughout the active phases of the cell cycle (S, G2, and M) but absent or very low in quiescent G0 cells. Staining a tissue or culture for Ki-67 and counting the percentage of positive cells gives you the proliferative fraction: what share of cells are actively cycling at that moment. It's widely used in cancer pathology to assess tumor aggressiveness. What it does NOT tell you is how fast those cycling cells are moving through the cycle. A high Ki-67 score means many cells are in the cycle; it says nothing about whether those cells are sprinting or crawling through G1.
How Growth Rate Changes Across Development and Tissues
Cell growth rate is not a fixed property of a species or even a cell type. It shifts dramatically depending on where a cell sits in development and what tissue it belongs to.
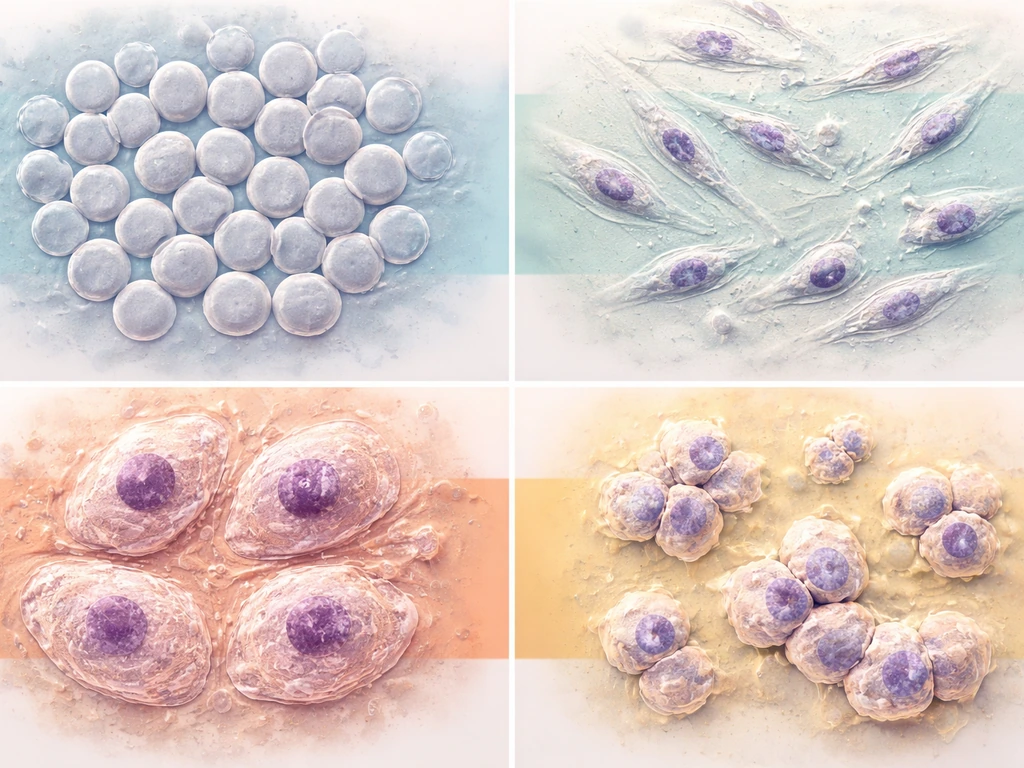
Embryonic cells divide rapidly and with relatively short G1 phases because they're building an organism from scratch and don't need much time for growth before dividing. Early embryonic divisions in many species are essentially just splitting an existing large cell into smaller ones, so growth isn't even required before division. As development proceeds, G1 lengthens, checkpoints tighten, and cells become more selective about when and whether to divide.
In adult tissues, the story is compartmentalized. Stem cell niches maintain a small population of actively cycling cells. The intestinal crypt is a perfect example: crypt base columnar (CBC) stem cells divide about once a day, producing transit-amplifying (TA) progenitors that cycle every 12 to 16 hours and crank out around 300 cells per crypt per day before differentiating at the crypt-villus junction. Meanwhile, the differentiated villus cells above them don't divide at all. Skin works similarly: basal keratinocytes divide steadily, but only for a limited number of rounds before differentiating, migrating upward, and eventually shedding. Full epidermal turnover takes 40 to 56 days in humans.
At the other extreme, terminally differentiated cells like neurons are essentially postmitotic. Adult neurons don't just cycle slowly; they've exited the cycle and in most cases can't re-enter it without triggering apoptosis. CDK inhibitors are chronically elevated, keeping them in a permanent G1-like arrest. This is a feature, not a bug: neurons need to maintain their connections and identity over a lifetime, and division would disrupt that.
Common Misunderstandings Worth Clearing Up
A few misconceptions come up repeatedly when people dig into cell growth rates. Here's what to watch out for.
- "Cell growth" and "cell proliferation" are the same thing: They're not. Growth is size increase; proliferation is number increase. A cell can grow without dividing, and a dividing population can consist of cells that are barely increasing in size between divisions. The terms get conflated a lot, including in some textbooks, but they describe different things.
- All cells grow at roughly the same speed: The range in this article alone spans from ~10 hours (hamster lung cells in culture) to essentially never (mature neurons). Even within a single organ, stem cells, progenitors, and differentiated cells operate on completely different timescales.
- A high Ki-67 score means cells are dividing fast: Ki-67 tells you the fraction of cells in the cycle, not the speed of the cycle. A tissue with 80% Ki-67-positive cells could have a cycle time of 12 hours or 48 hours. You need the actual cycle-time measurement to distinguish those cases.
- Doubling time equals cell cycle time: Only if every cell in your population is actively dividing. In most real cultures and virtually all tissues, some fraction of cells are quiescent (G0). The measured population doubling time is longer than the cycle time of the actively dividing subset because quiescent cells drag the average down.
- Cancer cells always divide faster than normal cells: Not necessarily. Many cancer cells actually have longer cycle times than their normal counterparts, but they bypass the checkpoints and limits (contact inhibition, senescence) that normally stop cells from continuing to divide. It's the loss of stopping signals, not pure speed, that drives tumor growth in many cases.
Finding the Right Number for Your Specific Cell Type
If you need a practical growth rate for a particular cell type, here's the fastest path to a reliable answer. First, check a curated database like BNID (BioNumbers) for your cell type; it aggregates measured cycle times from the literature for dozens of cell lines and primary cell types. Second, if you're working in the lab, a simple cell count doubling time is your fastest starting point: count during log-phase growth, space counts by at least one expected doubling interval, and calculate from there. Third, if you need phase-level resolution (you want to know whether G1 or S phase is the slow step), run a BrdU or EdU pulse-chase experiment with flow cytometry. Fourth, if you're looking at a tissue rather than a culture, Ki-67 staining gives you the proliferating fraction, but pair it with BrdU incorporation or phase-distribution data if you want actual timing.
The big takeaway is that there's no single answer to "how fast do cells grow" because cell growth rate is a context-dependent variable, not a fixed constant. The useful question is always: which cell type, in which tissue, under which conditions, and measured by which method? Once you've pinned those down, the number is findable, either from existing literature or from a straightforward experiment. And once you understand the control logic (nutrients feeding mTORC1, growth factors clearing the restriction point, checkpoints gating G1/S and G2/M), the range of numbers you see across different cell types stops being confusing and starts making intuitive sense. If you’re working in Excel and want to visualize or calculate a growth-rate trend from your cell-cycle measurements, you can use how to make cells grow with text in excel.
FAQ
If I measure doubling time, does that automatically tell me how fast the cells grow in size?
Not necessarily. A fast cell cycle can coincide with slower cell size growth if the division step is proportionally shorter, and the reverse can also happen. If you care about “how fast” in the size sense, you need a size readout (for example, imaging or flow cytometry forward scatter) rather than relying only on phase timing or population doubling time.
Why does my calculated doubling time look wrong when I use cell counts at two time points?
Yes, because doubling time assumes exponential growth. If your culture is not in log-phase, the cell counts will deviate from a straight exponential trend, and the calculation will under- or overestimate the true proliferative rate. A practical fix is to select two time points that bracket a visually exponential portion of the growth curve, ideally with consistent seeding density.
Can CFSE give an incorrect picture of how fast cells are dividing?
CFSE dilution can be misleading in mixed or non-uniform populations, especially if not all cells divide or if cells divide at different rates within the same sample. In that case, the fluorescence peaks can broaden and the “average divisions” may not represent the main proliferating subpopulation. Using a gating strategy to analyze only viable, comparable cells and checking for multiple subpopulations improves accuracy.
What are common pitfalls when estimating S-phase or G2+M duration from BrdU or EdU chase experiments?
Flow cytometry timing depends on what you label and how you gate. For EdU or BrdU pulse-chase, short pulses need tight control of timing, and DNA synthesis detection requires correct staining conditions. Also, the “leading edge” re-entry method assumes a reasonably synchronized cohort; otherwise you may get smeared phase estimates.
If Ki-67 is high, does that mean cells are cycling fast?
Ki-67 tells you what fraction of cells are cycling, not the speed of those cycling cells. Two tissues can have the same Ki-67 positive fraction but very different cell-cycle lengths due to different G1 durations or different checkpoint activity. To get speed, pair Ki-67 with BrdU/EdU incorporation, an S-phase marker, or direct phase distribution measurements.
How can I tell whether slow growth is due to quiescence (G0) versus DNA damage arrest?
There is a key distinction between “cells not dividing because they are quiescent” versus “cells not dividing because they are damaged or dying.” In quiescence, cells often maintain viability and can re-enter once conditions improve. In damage response or senescence, they may remain arrested but with different signaling and marker patterns. If you want to know whether it is reversible, test recovery after restoring nutrients or growth factors.
How should I interpret cell-cycle timing measurements in red blood cell studies?
Red blood cells are an exception because mature erythrocytes cannot divide, so their “growth” is not a cell-cycle event. If you are studying erythropoiesis, you should measure the maturation rate of precursors in bone marrow or the conversion timeline of reticulocytes, not a mitotic cycle length. Using population doubling time on mature RBCs would produce misleading results because there is no division to measure.
What experimental checks can help identify what is slowing the cell cycle in my system?
Cells can appear to “grow slowly” due to a bottleneck in G1, but that can come from multiple upstream causes. A useful diagnostic is to test sensitivity to growth-factor signaling versus nutrient availability, since growth-factor withdrawal can delay re-entry differently than amino acid scarcity. Measuring response after restoration (how quickly cells re-enter) helps identify which control layer is limiting.
Why can proliferative fraction and tumor growth rate disagree?
Not always, because a higher proliferative fraction can mask a lower per-cell cycle speed. For example, a tumor might have many Ki-67 positive cells but still be slow-cycling if G1 is long, or it might have fewer cycling cells that are very rapid. If your endpoint is tumor growth or cell expansion, consider measuring both proliferative fraction and actual cell-cycle length.
Will the cell-cycle time from a cell line always match what happens in tissue?
Yes. Many rates reported from in vitro cultures differ from in vivo behavior because cells experience different oxygen levels, extracellular matrix constraints, immune signals, and mechanical cues. If you need in vivo relevance, consider tissue context markers and an in situ approach (or at least validate in culture conditions that mimic the tissue microenvironment).
Why does my dataset show a broad range of cell-cycle times instead of a single number?
Population averages can hide subcycling, meaning a sample contains multiple groups with different cycle speeds. This is especially common in early culture, mixed stem cell and progenitor populations, and tumors. If the data show broad or multimodal phase distributions, calculate phase durations per subpopulation rather than averaging across all cells.
Next Article
What Controls When and How Fast Cells Grow and Divide
Learn what controls cell division timing and speed: checkpoints, signals, resources, DNA damage, stress, and failure lea