Chapter 5 Lesson 1 on how populations grow is almost always testing two core models: exponential growth (the J-shaped curve) and logistic growth (the S-shaped curve), plus the concept of carrying capacity. If you can clearly define those three things, read their graphs correctly, and explain what shifts a population from one model to the other, you will get the right answers on every typical question in this lesson.
Chapter 5 Lesson 1 How Populations Grow Answer Key

Marcus Whitmore
2 May 2026
What Chapter 5 Lesson 1 is really testing
This lesson is not just asking you to memorize vocabulary. It is asking you to explain the logic behind population growth. Why does a population grow fast at first? What slows it down? What stops it? The questions are designed to check whether you understand the relationship between resources and population size, not just whether you can match a term to a definition.
Most Lesson 5.1 assessments (across Pearson, Savvas, and similar textbook editions) test these specific skills: identifying which growth model applies to a given scenario, reading and interpreting growth curve graphs, defining key terms like carrying capacity and per-capita growth rate, and explaining what happens when a population exceeds or approaches its environmental limits.
If you have seen the sibling topics on how populations grow in biology or the broader 5.1 how populations grow answer key, you will notice the same core concepts appear across all of them. That is intentional. The lesson is built around a small set of powerful ideas that connect together.
Key concepts and terms for population growth
Before you can answer any question in this lesson correctly, you need these definitions locked in. Not word-for-word, but in your own understanding.
| Term | Plain-language meaning | What it looks like on a graph |
|---|---|---|
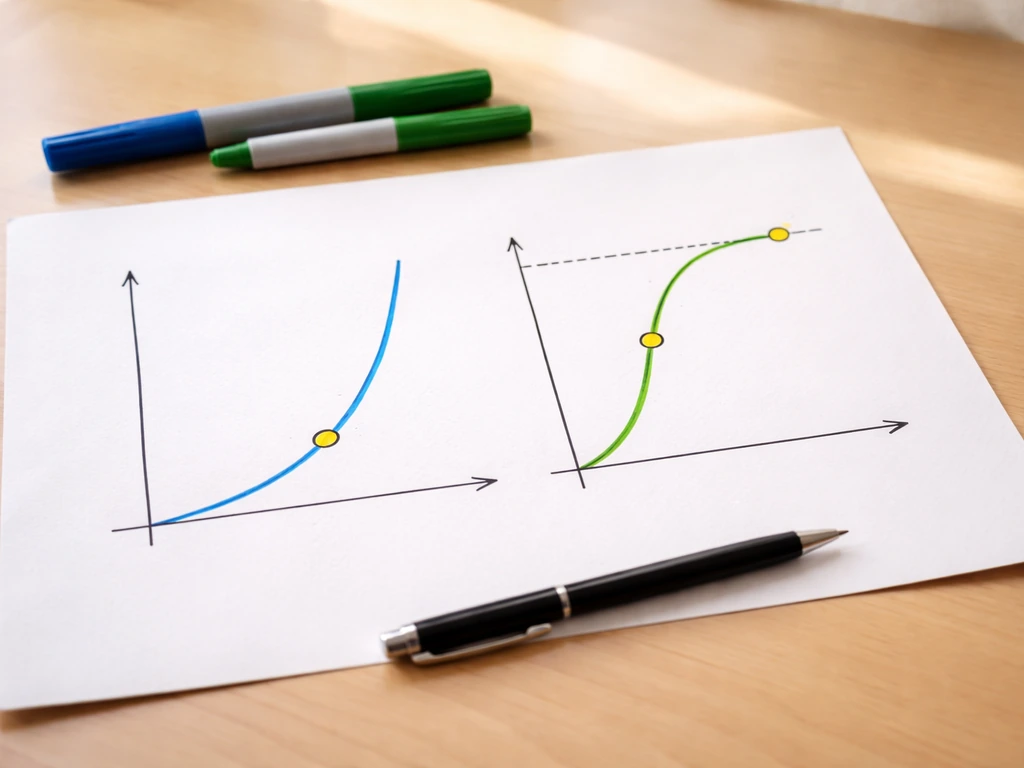
| Exponential growth | Population doubles at a constant rate when resources are unlimited | J-shaped curve that curves upward sharply with no flattening |
| Logistic growth | Population grows fast at first, then slows as resources get tight, then levels off | S-shaped curve with a clear top plateau |
| Carrying capacity (K) | The maximum number of individuals an environment can sustainably support | The flat line at the top of the S-curve |
| Per-capita growth rate | The average rate at which each individual contributes to population growth | Stays constant in exponential growth; drops as population nears K in logistic growth |
| Limiting factors | Resources or conditions (food, space, water) that cap how large a population can get | What causes the S-curve to bend and flatten |
A good memory anchor: think of exponential growth like a sourdough starter with unlimited flour. It doubles and doubles and keeps going. Logistic growth is that same starter in a jar with a lid. It grows fast, slows as the jar fills up, and eventually stops when there is no more room. The lid is the carrying capacity.
Population growth models and how to interpret them
The J-curve: exponential growth
Exponential growth happens when a population has access to unlimited resources and no significant predators or disease pressure. The key feature is that the per-capita growth rate stays constant. Every individual produces offspring at the same rate no matter how large the population gets. This is why the curve accelerates upward rather than leveling off. A bacteria colony in fresh nutrient broth, or a small invasive species introduced to a new habitat with no natural enemies, are classic real-world examples.
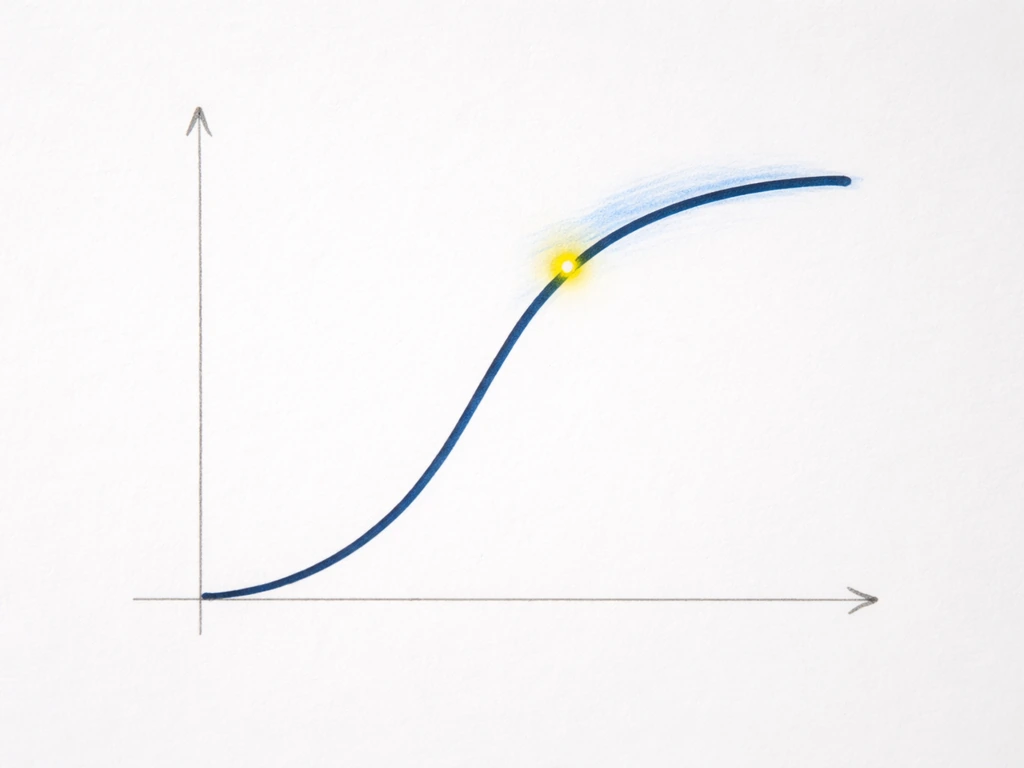
The S-curve: logistic growth

Logistic growth has three distinct phases, and you should be able to identify all three on a graph. First, the population grows rapidly because resources are plentiful and population size is still low. Second, growth slows as the population gets larger and resources become scarce. Third, growth stops (or nearly stops) as the population reaches carrying capacity. The curve flattens into a horizontal plateau at K.
The critical insight here is that as population size increases, per-capita growth rate decreases. Khan Academy explains that as resources become limited and the population approaches carrying capacity, the per-capita growth rate decreases, producing the logistic S-shaped pattern. This is the fundamental difference from exponential growth. More individuals means more competition for the same limited resources, which means each individual contributes less to net population growth.
Reading the graph: what to look for
- Is the curve still accelerating upward with no plateau? That is exponential (J-shaped).
- Does the curve start steep, bend in the middle, and flatten at the top? That is logistic (S-shaped).
- Where does the curve level off? That horizontal line marks the carrying capacity K.
- If a question shows a population above K, the next step is always decline, not continued growth.
- If a question shows a population well below K, growth will be rapid and close to exponential.
Common question types and how to solve them step by step
Question type 1: Define and distinguish growth models
The question might say: "Compare exponential and logistic growth" or "Which type of growth produces a J-shaped curve?" Here is how to answer every time.
- State the model name and its curve shape (exponential = J, logistic = S).
- Describe the resource condition that produces it (unlimited resources = exponential; limited resources = logistic).
- Explain what happens to per-capita growth rate (stays constant in exponential; decreases as population grows in logistic).
- If the question asks for a comparison, mention carrying capacity as the defining feature of logistic growth that exponential growth lacks.
Question type 2: Identify parts of a growth graph
- Look at the overall shape first. J or S?
- Find the inflection point on an S-curve (where the curve changes from speeding up to slowing down). This is where growth rate is at its maximum.
- Find the plateau. Draw a horizontal line through it. Label this K (carrying capacity).
- If asked where growth is fastest, point to the steepest part of the curve, which on an S-curve is around the midpoint, not at the beginning.
Question type 3: Predict what happens next
These questions give you a population at a specific point on the graph and ask what happens next. This same logic helps explain how do families grow when resources and limits change over time population growth. Apply this logic: if the population is below K, it will continue growing (faster if well below K, slower if close to K). If the population is at K, growth rate is approximately zero. If the population somehow overshoots K, expect a decline back toward K because resources cannot support that many individuals.
Question type 4: Explain what limits growth

- Name the concept: limiting factors.
- Give examples appropriate to the scenario: food, water, space, light, predation, disease.
- Connect limiting factors to logistic growth: as the population grows, limiting factors have a greater effect, which reduces the per-capita growth rate and eventually stops growth at K.
Answer-by-answer reasoning and quick verification
Here is how to check your answers against the underlying logic of the lesson rather than just hoping you memorized the right thing.
If your answer involves exponential growth
Verify: Did you describe unlimited resources? Did you say the per-capita rate is constant? Did you use the word J-shaped or describe a curve that keeps accelerating? If yes to all three, your reasoning is solid. If you described any slowing or leveling off, you accidentally described logistic growth instead.
If your answer involves logistic growth
Verify: Did you mention three phases (fast growth, slowing, leveling off)? Did you mention carrying capacity? Did you explain that per-capita growth rate decreases as population size increases? All three of those elements should appear in a complete answer about logistic growth.
If your answer involves carrying capacity
Verify: Did you define it as the maximum population an environment can sustain? PhysSandbox also presents logistic growth using dN/dt = rN(1 − N/K), where K is the carrying capacity, the maximum sustainable population the environment can support. Did you connect it to limited resources? Did you place it correctly at the plateau of the S-curve rather than somewhere in the middle? Carrying capacity is specifically the upper limit, not the population size where growth is fastest (that is the inflection point, which is a common mix-up).
Quick self-check table
| Answer you wrote | Check this | If wrong, fix by... |
|---|---|---|
| Exponential growth = S-shaped curve | It should be J-shaped | Swap to J-shaped; S-shaped is logistic |
| Carrying capacity is in the middle of the curve | K is the plateau at the TOP | Move K to where the curve flattens |
| Logistic growth has unlimited resources | Logistic needs LIMITED resources | Add 'limited resources cause the growth to slow' |
| Growth is fastest right at carrying capacity | Fastest growth is at the inflection point (around K/2) | Clarify that growth rate peaks at the midpoint, not at K |
| Per-capita rate increases as population grows (logistic) | It decreases in logistic growth | Flip: more individuals = more competition = lower per-capita rate |
Common mistakes and how to avoid losing points
Mixing up the curve shapes
This is the single most common error. J-curve is exponential, S-curve is logistic. A simple way to remember: J looks like a curve that just keeps going up with no end. S curves up, bends, and levels off. If you draw them out once on scratch paper before an exam, the shapes stick.
Confusing where growth is fastest with carrying capacity
Students often mark the inflection point (where the S-curve bends) as carrying capacity. That point is actually where growth rate is at its maximum, roughly around K divided by 2. Carrying capacity is the flat top of the curve, where growth rate drops to near zero.
Forgetting the three phases of logistic growth
A one-sentence answer about logistic growth is almost always incomplete. Teachers and rubrics look for the three-phase structure: exponential increase phase, deceleration phase, and plateau at K. If you only describe the end result (population stops growing), you leave out most of the explanation and lose points.
Not connecting limiting factors to the model
Saying 'logistic growth occurs when resources are limited' is the starting point, not the full answer. You also need to explain the mechanism: limiting factors reduce per-capita reproductive success as population density increases, which is what bends the J-curve into an S-curve. That causal chain is what earns full credit.
Study next steps: practice strategy and what to review
If you got through this guide and some parts still feel shaky, here is exactly where to focus your next study session.
- Draw both curves from memory without looking. Label the axes (population size on Y, time on X), mark K on the logistic curve, and label the three phases. If you can do this cold, you have internalized the core content.
- Practice writing one-paragraph answers to 'Compare exponential and logistic growth' until you automatically include: curve shape, resource condition, per-capita rate behavior, and carrying capacity.
- Review any worked examples from your textbook or notes where a real population (bacteria, deer, invasive fish) is used. These show how abstract models apply to real scenarios, which is often what harder test questions use.
- Check your notes on the 5.1 how populations grow biology answers topic, which often includes worked examples from the same chapter framework and can give you more practice scenarios.
- If your teacher uses graphs on assessments, practice identifying the inflection point and the plateau on several different S-curves. The exact shape varies, but the logic stays the same.
- For each term on your study guide, write a one-sentence 'because' explanation. Not just 'carrying capacity is the maximum population size' but 'carrying capacity is the maximum population size because the environment only has enough resources to support that many individuals without decline.'
One last thing worth remembering: this lesson is about constraints on growth. The same question of 'what stops growth and why' appears throughout biology, whether you are studying cells that cannot grow past a certain size due to surface-area-to-volume limits, or whole populations that cannot grow past K. That same idea of limiting factors is the core of how populations grow in biology. The logic is the same at every scale. Once you internalize that principle, population growth questions stop feeling like memorization and start feeling like applied reasoning, which is exactly what your teacher is hoping for.
FAQ
How can I tell exponential from logistic on a graph in under 10 seconds?
Use this quick decision rule: if the population size keeps increasing without any upper limit implied, it is exponential. If the graph rises, then visibly bends and then flattens to a plateau labeled K, it is logistic.
What should I say specifically about per-capita growth rate for exponential versus logistic growth?
If the question asks about per-capita growth rate, exponential means it stays roughly constant as N increases. Logistic means per-capita growth rate declines as N rises because each individual has less access to limiting resources.
Where do students usually go wrong when identifying K on a logistic (S-shaped) curve?
Carrying capacity is the maximum population the environment can sustain long-term. The inflection point is where growth rate is fastest (roughly around K/2 on many textbook curves), not where growth stops.
If a problem gives the population at a certain point, how do I predict the direction of change?
To interpret “what happens next” questions, look at where the current population sits relative to K. Below K, growth continues, above K the population tends to drop back toward K, and at K the net growth rate is near zero.
What does overshoot past carrying capacity mean, and how should I explain it?
An overshoot scenario happens when the population temporarily exceeds K, then declines due to stronger limiting effects (for example, depleted nutrients, reduced space, higher disease transmission). The key is that growth becomes negative until the population returns near K.
If logistic growth “stops,” does that mean individuals stop reproducing completely?
For logistic curves, the plateau represents near-zero net growth over time. Even though per-individual reproduction may still occur, the limiting factors cause mortality and failed reproduction to balance reproduction so the population stays approximately steady.
If environmental conditions change, does that shift exponential or logistic growth, and what changes in the model?
When the prompt mentions a change in resources or pressures, think “shift in carrying capacity K” or “change in growth rate.” More resources or fewer limiting pressures raise K, while harsher limiting conditions lower K, which changes where the plateau sits on the graph.
What causal explanation earns full credit when a rubric asks “why” growth slows in logistic growth?
If you are asked to explain a causal mechanism, state the chain: as density increases, limiting factors intensify, per-capita reproductive success decreases, and that reduction in per-capita growth is what bends the J-curve into an S-curve.
How should I handle questions that mention both maximum growth rate and carrying capacity?
If a question mixes concepts like “maximum growth rate” and “carrying capacity,” match terms carefully: maximum growth rate corresponds to the inflection point, while carrying capacity corresponds to the long-term plateau (where growth rate is near zero).
What is a high-scoring one-sentence comparison of exponential and logistic population growth?
For a one-sentence comparison, include three elements: exponential (J-shaped), logistic (S-shaped), and that logistic has a carrying capacity where per-capita growth rate decreases with increasing population size.
Next Article
How Do Families Grow and Change Over Time
Understand how families grow over time using biological growth mechanics, stages, limits, and practical steps to support